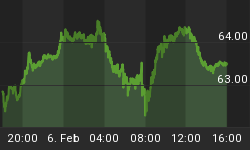
Over the past two weeks, The Sentimeter has gone from bullish optimism to extreme bullish optimism. There are a lot of equity bulls. Over the past 2 years such signals have been mixed. In other words, the indicator and data behind The Sentimeter have inconsistently predicted intermediate term market tops. Since 2010, there have been 7 similar signals. 4 signals led to intermediate term market tops; the 2 failed signals coincided with Federal Reserve monetary programs; and 1 signal saw the market go flat for about 6 weeks. The two signals that coincided with Fed policy interventions were in November, 2010 (QE2) and in December, 2012 (QE4).

See the Equity Market Investor Sentimeter above, which is our most comprehensive sentiment indicator. This indicator is constructed from 10 different data series including opinion data (i.e., how do you feel about the market?) as well as money flow data (i.e., where is the money going?). This is the current state of equity market investor sentiment.
In the bigger picture, this type of market dynamic is late cycle. The key to navigating to this market environment is understanding where you are on the playing field.

Want more TacticalBeta? See our pricing chart and upgrade today. Get Started Now


