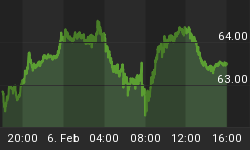
The dollar is really pushing its luck here, having risen to hit 3 separate but concurrent targets. In the last update we forecast that it would confound most pundits by stubbornly pushing higher, despite the heavy resistance, and such has proved to be the case. We can see 2 of these trendline targets on the 6-month chart, and an additional trendline target on the 4-year chart further down the page. Looking at the 6-month chart more closely we can see how the gains of the past 2 weeks have been hard won, this is because, as we can plainly see, it has been nudging the resistance of these 3 trendlines.

So, what now? Being at no less than 3 trendline targets it is logical to conclude that the rally has about run its course and that we can expect renewed decline shortly. Even if it does manage to break above these trendlines, it is already close to its normal overbought limit, as we can see on the 6-month chart, and this fact combined with the heavy resistance between the present level and 90, plainly visible on the 4-year chart, should serve to finish it off. However, before it throws in the towel it may have one last trick up its sleeve. It might stage a dramatic false breakout above the trendline, only to do an about face and then drop steeply. This kind of move is designed to fool and wrong foot a large number of traders, and is strongly suspected that moves of this nature are "engineered". We saw a dramatic example of this in silver at the end of November, when it broke above a 2-month creeping uptrend, only to turn tail and collapse.

The gold chart mirrors that of the dollar in that gold is holding above a shorter-term trendline, as can be seen on the 1-year chart. Gold broke down earlier in the month from a symmetrical triangle formation that started to develop early in December, the measuring implications of which suggest a downside target in the $400 area, however, COT figures suggest that a bottom is close, and the price action since mid-March can be construed as a falling wedge, which is bullish. If we do see a false upside breakout by the dollar, as described above, what may happen is that gold has a $10 or so down day, and then that's it, the bottom is in. Gold stocks are unlikely to be affected much by such a move as they have already discounted the low, and should not drop below their recent lows, at worst. If the dollar turns lower here, then we are already looking at the low in gold.

On the 4-year chart, we can see that although gold has broken down from its long-term uptrend, the break is, so far, only marginal. However, if the dollar continues to strengthen in coming weeks, and achieve more than a false breakout, then there is clearly scope for gold to correct back to support at the $400 level. That said, should the dollar now go into retreat as expected, gold is expected to pick up from the strong support at the current level.


