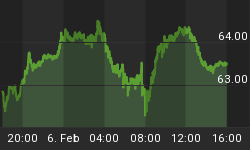
When we look at the daily chart of the Sigma Whole Market Index, we got a breakout of the uptrend on Friday. Is it a real breakout or is it a false break? This is the key question.

Nevertheless, when we look at the chart of the Sigma Whole Market Index on a weekly basis, the situation is very different. The market is at the top end of a rising wedge, and this pattern is rather bearish.

When we look at our indicators, the Sigma Trend Index(STI) surged to '72'. We didn't get a sell signal at this time but it is nearly impossible to avoid it next week. Why? If the market achieves a meaningful decline, the Swing and/or the Power Level will activate the sell signal. At the opposite, if the market continues to surge, the STI will increase above the '80' level and at this level we get an automatic activation of the sell signal (whatever the Swing and the Power Level do). (for more information on our methodology, you can visit our site).
The only way to avoid a sell signal would be to remain flat during the next 3 sessions. It is possible, but we doubt it will happen.

Thanks to the surge in market prices, the ST model updated some stop levels:


Short Term Trading Book:
- SPX: 1 long at 1691.97 (stop @ 1674, 3pts below the ST model to take into account bid/ask spread)
- NDX: 1 long at 3204.34 (stop @ 3156, 5pts below the ST model to take into account bid/ask spread)
- CAC: 1 long at 4219.62 (stop @ 4155, 5pts below the ST model to take into account bid/ask spread)
- DAX: 1 long at 8717.86 (stop @ 8452, 10pts below ST model to take into account bid/ask spread)
- EStoxx: 1 long at 2974.95 (stop @ 2896, 5pts below the ST model to take into account bid/ask spread)
Medium Term Trading Book:
- No more medium term position at this stage.
For those of you interested in our trades or in our methodology, you can visit our site. A full description of our ST model and MT model is available on our site. You can also subscribe to our twitter account (@SigmaTradingOsc), it is free and you are updated on our latest view/trades.


