• 748 days Will The ECB Continue To Hike Rates?
  • 748 days Forbes: Aramco Remains Largest Company In The Middle East
  • 750 days Caltech Scientists Succesfully Beam Back Solar Power From Space
  • 1,150 days Could Crypto Overtake Traditional Investment?
  • 1,154 days Americans Still Quitting Jobs At Record Pace
  • 1,156 days FinTech Startups Tapping VC Money for ‘Immigrant Banking’
  • 1,159 days Is The Dollar Too Strong?
  • 1,160 days Big Tech Disappoints Investors on Earnings Calls
  • 1,161 days Fear And Celebration On Twitter as Musk Takes The Reins
  • 1,162 days China Is Quietly Trying To Distance Itself From Russia
  • 1,163 days Tech and Internet Giants’ Earnings In Focus After Netflix’s Stinker
  • 1,166 days Crypto Investors Won Big In 2021
  • 1,167 days The ‘Metaverse’ Economy Could be Worth $13 Trillion By 2030
  • 1,168 days Food Prices Are Skyrocketing As Putin’s War Persists
  • 1,170 days Pentagon Resignations Illustrate Our ‘Commercial’ Defense Dilemma
  • 1,170 days US Banks Shrug off Nearly $15 Billion In Russian Write-Offs
  • 1,173 days Cannabis Stocks in Holding Pattern Despite Positive Momentum
  • 1,174 days Is Musk A Bastion Of Free Speech Or Will His Absolutist Stance Backfire?
  • 1,174 days Two ETFs That Could Hedge Against Extreme Market Volatility
  • 1,176 days Are NFTs About To Take Over Gaming?
Is The Bull Market On Its Last Legs?

Is The Bull Market On Its Last Legs?

This aging bull market may…

How The Ultra-Wealthy Are Using Art To Dodge Taxes

How The Ultra-Wealthy Are Using Art To Dodge Taxes

More freeports open around the…

The Problem With Modern Monetary Theory

The Problem With Modern Monetary Theory

Modern monetary theory has been…

  1. Home
  2. Markets
  3. Other

Elliott Wave Outlook For Crude Oil And Copper

Originally published 8:00 am PST October 30, 2013
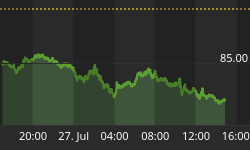


OIL 4h

Crude oil is trading lower and based on latest decline through 100 mark and down 96.00 we suspect that larger picture on this market is changing. For now we will focus on current structure which is showing a completed wave B around 103.00 level followed by recent push lower with accelerating price action through 100 mark which we think it was wave (iii), so decline should then be made by five waves down. As such, we think that bounce from the low is just another correction within downtrend. We are talking about wave (iv) that is pointing lower for wave (v), towards 95, 94 zone.

Crude Oil Chart - 4 Hour Data


COPPER 4h

We do not look at copper very often, but I see a triangle on 4h chart, maybe already finished because of recent rally back to 3.318. We however prefer a 3.3500 breakout on a daily close basis to confirm end of a triangle and further bullish waves up to 3.450 maybe even to 3.500.

Copper Chart - 4 Hour Data


Elliott Wave Education: Triangle Pattern

A Triangle is a common 5 wave pattern labeled A-B-C-D-E that moves counter-trend and is corrective in nature. Triangles move within two channel lines drawn from waves A to C, and from waves B to D. A Triangle is either contracting or expanding depending on whether the channel lines are converging or expanding. Triangles are overlapping five wave affairs that subdivide 3-3-3-3-3.


Contracting Triangle

Bull Market vs Bear Market

  • Structure is 3-3-3-3-3
  • Each subwave of a triangle is usually a zig-zag
  • Wave E must end in the price territory of wave A
  • One subwave of a triangle usually has a much more complex structure than others subwaves
  • Appears in wave four in an impulse, wave B in an A-B-C, wave X or wave Y in a double threes, wave X or wave Z in a triple threes


Written by www.ew-forecast.com Try Ew-Forecast.com's Services Free For 7 Days Here

FREE WEBINAR On Elliott Wave Principle Reserve Your Seat Here


Back to homepage

Leave a comment

Leave a comment