


In my last article I was looking for a reaction from the 1750SPX area. The continuation of the move higher has again forced me to reconsider other ideas.
In my last article, I was initially looking at a possible ending diagonal on the SPX (bearish wedge to non Elliotticians) but as I re-evaluated price structure in the other main US markets it became much clearer that the pattern in the SPX was not an ending diagonal as I initially thought, but some sort of ugly unorthodox flat pattern.
Although technically the ending diagonal pattern is still valid, but in light of the evidence in other US markets I decided to adjust the pattern to reflect the ideas on the Dow Industrials as well as the Dow Composite.
Bearish Idea
The move off the March 2009 lows currently counts best as a 3 wave move; I can count a 3 wave move, which in my opinion is very close to a reversal.

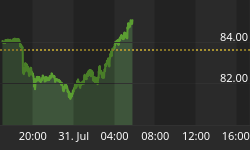
Since my last article the SPX has moved just over 50 points, however the angle of the advance looks wrong for the previous ending diagonal idea. As I mentioned earlier, the patterns on the Dow industrials and Dow composite show a much clearer idea, which I think are important clues.
The SPX is slowly coming into a fibbo price time target I have been following. But without a reversal clue, this grind can push higher than the bears can stay solvent. Although we have been following the short term charts higher, it's now I think once again that a possible reversal can be seen, it's this area that an important reaction could be seen.
DOW Industrials
If you look at the price action in the same time span, you can clearly see that the Dow has a sideways appearance and looks far better as a flat pattern which I suspect is a 4th wave, so this current move I suspect is a terminal 5th wave, once finished we should be seeing a strong reversal.

DOW Composite
If you look at the same period this market appears to be showing a triangle, which is a common pattern for a 4th wave, so the evidence supports this last "spike" being a 5th wave, which is a terminal move in a 5 wave sequence.

So whilst the price action on the SPX is ugly, the price structure on 2 other US markets, are showing much clearer price structure.
If the move from the March 2009 lows is that of a 3 wave move and close to ending a large B wave for an expanded flat pattern, then I am expecting the March 2009 lows to be tested over the coming years ahead.
Bullish Idea
An alternative idea I have been following is that the markets are close to ending wave [3], so any decline will be a complex decline for wave [4] and setup for a move higher for wave [5] and complete a 5 wave sequence from the March 2009 lows.
So from the 2000 top into the 2009 lows we saw what Elliotticians refer to as an expanded flat and the market is now involved in a larger 5 wave advance.
But even this idea suggests a large pullback is due, as a decline to correct the last up cycle can easily see a decline of 200 points on the SPX. So whilst the bullish wave count is not my preferred idea, it still suggests that we are approaching areas where we should see a large decline, even if we see a decline for wave [4] for the bullish idea.
Wave [4] should target 1600 on the SPX and 14000 on the Dow.


One for the crazies
Just to show readers that I am non-biased and willing to follow what price decides, I have also been following what I call the "crazy count".

This is the most bullish count I have and if the market is involved in something exceptional then we have a long way to go before this is finished, both in terms of price and time.
However I think the prior bullish wave count is a better fit based the current price structure.
Again, even this count suggests a 200 point move lower, so all 3 ideas suggest that we can see a large decline.
Sentiment is extremely bullish, I don't think there is a bear around apart from us, and literally everyone has folded and gone bullish.
I would say that this is a perfect cocktail, sentiment; bears have now capitulated and wave structure, all setup and ready for a large move lower.
So recap, my preferred idea is the bearish count and close to ending the move from the March 2009 lows, my alternative idea is the bullish idea, I will have a better idea based on any decline if any price decline fits better for the bullish idea for wave [4].
The crazy bullish count is my last option, as always I will simply adjust to what the markets suggest.
But all 3 ideas still suggest a large decline is setting up in my opinion.
In terms of percentage I rate the bearish count as 60% likely, the bullish count as 30% and the mega bullish idea as a 10% chance.
Over the coming months, I won't be posting many articles, perhaps 1 or 2 a month as it takes a lot of my time but readers are welcome to sign up to become a member to follow these ideas on a daily basis.
DOW 2000 Top
Although it's a few days old, I posted this analogue to members a few days back, it's something I noticed a couple of weeks back and have been following.

If you look at the today's price movements it looks similar to the price movements into the 2000 top.
Whilst many market technicians have highlighted the 1929 analogue I think the 2000 top analogue is actually a better fit.
So whilst history never repeats it should does look like it's trying to rhyme.
Until next time,
Have a profitable week ahead.


