

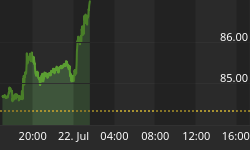


Looking at the chart of the Sigma Whole Market Index, we can notice a small bounce back on Tuesday and a retest (by the south) of the green horizontal line. We are not convinced it is (already) the end of the correction. It looks like a dead cat bounce before a new downleg. Wait and see...

The Sigma Whole Market Index was trading out of its bollinger bands so there is no surprise that we got a bounce back. What is more worrying is the fact we are currently trading below the 50days moving average and this moving average is now declining.

Looking at our indicators, the Swing was at '4' and as the Trend Level (TL) was at '5' on Tuesday, we got a new buy signal.

We calibrated the different parameters of the ST model on the IBEX. According to the 2 years back testing that we realized on the IBEX, the model generated 70.8% return on 2 years vs 17.7% for the IBEX (chart below). Back testing results were so good that we decided to launch a live test on the IBEX.

The ST model computed new stops on all indexes. We bought the SPX at US close and we bought the EU positions around 8am CET:


Short Term Trading Book:
- SPX: long at 1754.73 (stop @ 1708, 3pts below the ST model to take into account bid/ask spread)
- NDX: long at 3506.23 (stop @ 3361, 5pts below the ST model to take into account bid/ask spread)
- CAC: long at 4107.69(stop @ 4030, 5pts below the ST model to take into account bid/ask spread)
- EStoxx: long at 2947.84 (stop @ 2883, 5pts below the ST model to take into account bid/ask spread)
- DAX: long at 9106.25 (stop @ 8707, 10pts below the ST model to take into account bid/ask spread)
- IBEX: long at 9745.8 (stop @ 9550, 10pts below the ST model to take into account bid/ask spread)
Medium Term Trading Book:
- No more medium term position at this stage.
Out of model position:
- no position at this stage
For those of you interested in our trades or in our methodology, you can visit our site. A full description of our ST model and MT model is available on our site. You can also subscribe to our twitter account (@SigmaTradingOsc), it is free and you are updated on our latest view/trades.


