A sharp impulsive reversal from the highs suggests that the S&P500 has reached a temporary top and that price is heading lower or sideways in wave 4. Wave 4 is a corrective leg so this can be only a temporary weakness but we still need three legs in (a)-(b)-(c) formation, before we may start looking back to the highs again. Based on the latest price action we see a completed wave (a), followed by wave (b) that may find resistance next week around 1800/20.
S&P500 Daily Elliott Wave Analysis

S&P500 Four Hour
S&P500 reversed nicely from the lows, clearly in five waves from 1732 which suggests that decline from the highs is completed, either as a five wave move in wave (a) or a zigzag labeled as alternate count. In both cases we need a minimum three waves to the upside. We see now wave a) at resistance of a former wave four, so traders should be aware of a pullback in the next few sessions, ideally back to 1750/62 zone before prices may continue up in wave c).
S&P500 4h Elliott Wave Analysis

S&P500 One Hour
The EUR rallied, USD fell at the end of last week after ECB press conference and worse than expected NFP figures. Meanwhile the US stocks and commodities rallied as bonds declined.
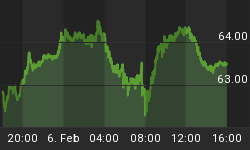
On S&P500 futures chart we can count five waves up from the lows, which is important structure for a bullish case. We are expecting minimum three waves up from the lows in this week, but before uptrend will resume we need a corrective wave b) move down to 1750/62 region where traders could be interested in long opportunities.
S&P500 1h Elliott Wave Analysis

Written by www.ew-forecast.com
14 days trial just for €1 >> http://www.ew-forecast.com/register


