


Movement above 19.824 and then 19.996 invalidated the main wave count and confirmed the alternate.
Silver has now finished its barrier triangle, and the next movement should be a five wave structure downwards. I will use the channels on the hourly chart to indicate when this trend change has occurred.

The triangle for intermediate wave (B) is now a complete barrier triangle. Within it the overshoot for minor wave E of the B-D trend line indicates that upwards movement is either over here or should be very soon.
At 10.85 intermediate wave (C) would reach 1.618 the length of intermediate wave (A). At 14.07 intermediate wave (C) would reach equality in length with the widest part of the triangle. This gives a wide target zone. When there is structure within intermediate wave (C) to analyse I will be able to use minor wave degree to add to the target calculation and narrow it down. I cannot do that yet.
Intermediate wave (C) may last about 18 weeks, if it is 0.618 the duration of intermediate wave (A).
If intermediate wave (B) moves higher (and the trend change is unconfirmed so it may do so) then it may not move beyond the start of intermediate wave (A) at 34.515.

The triangle structure is correct and now either complete here or extremely close to completion.
I know members and visitors will comment that this wave count does not fit with Gold. I disagree. Gold expects downwards movement for a B wave at minor degree and this may coincide with Silver's first wave down at minor degree. When Gold expects a following upwards wave for a C wave at minor degree this may coincide with a deep second wave correction for minor wave 2 on Silver. They most certainly can move together. However, Gold and Silver do not always have their highs and lows at the same point in time. Silver tends to lead Gold.
If this wave count is correct then intermediate wave (C) should begin either here or extremely soon. Once there is some indication of this trend change on the hourly chart with channel breaches I would have some more confidence in this wave count.
Minor wave E has overshot the A-C trend line. E waves of triangles most commonly undershoot the A-C trend line, but when they do not then they tend to overshoot the trend line (they do not end right at the trend line). This gives the triangle structure a typical look and indicates it should be ending about now.
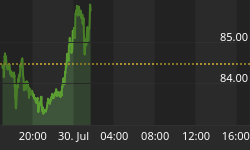
While the trend change is not indicated on the hourly chart the invalidation point remains at 22.224. Minor wave E may not move beyond the end of minor wave C.

Within minor wave E zigzag I have drawn a parallel channel about minute wave c using Elliott's second technique: draw the first trend line from the lows of minuette waves (ii) to (iv), then place a parallel copy upon the end of minuette wave (iii). This trend channel is overshot by a strong fifth wave which is typical behaviour for a commodity market. When this channel is breached by downwards movement I will have confidence that minor wave E is over and there has been a trend change to the downside.
In the first instance a breach of the channel containing minuette wave (v) would provide earliest indication of this trend change.
There is no Fibonacci ratio between minute waves a and c within minor wave E zigzag.
Ratios within minute wave c are: minuette wave (iii) is 0.081 short of 4.236 the length of minuette wave (i), and there is no Fibonacci ratio between minuette wave (v) and either of minuette waves (i) or (iii).
Ratios within minuette wave (v) are: there is no Fibonacci ratio between subminuette waves iii and i, and subminuette wave v is so far 0.066 longer than equality with subminuette wave i.
The question mark next to the end of intermediate wave (B) indicates that it is not clear yet if this upwards movement is over. I want to see the channels on the hourly chart clearly breached before I have confidence in this trend change. If this wave count is correct then this trend change should happen within 72 hours, probably sooner rather than later.


