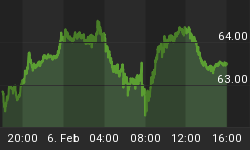
Oil futures were on the tip of every political and financial pundits' tongues less than a month ago as geopolitical tensions in Iraq heated up. Fast forward to today, and tensions in the Middle East have intensified further. However, since June 25th oil prices have been falling fast.
Oil futures prices have fallen from around $107.50 per barrel down to around $101.50 / barrel as I am writing. As the chart below indicates, oil futures should see some support around the $101 per barrel price level and stronger support yet down around $98 per barrel.
Is this a pullback that is setting up for a larger move to the upside, or is oil prices going to move down toward $95 / barrel again? Purely from a statistical standpoint, including June 25th through today oil prices have traded 12 sessions. During those 12 trading sessions, oil prices only managed to close in positive territory 4 times with some very strong selling pressure along the way. In raw percentage terms, oil futures have lost nearly 5.5% since June 25th peak to trough.
Purely from a statistical standpoint, the probabilities are favorable that at the very least a bounce could play out in the near future that lasts several trading sessions. Furthermore, that bounce could turn into a stronger move to the upside in the weeks ahead. Obviously at this point it is purely speculation, but the intermediate to longer term trend on the daily time frame is clearly to the upside.
Instead of just rushing in and buying a long oil position using futures or purchasing an oil ETF like USO, I wanted to construct an option trade that would capitalize from higher oil prices in the near term, but with some hedging in case more downside occurs.
In order to accomplish this, I am going to use a standard Iron Condor trade construction. This construction capitalizes on time decay and volatility decay. Additionally this structure will allow traders to profit from a consolidating price pattern as the profitability is measured in a range.
However, when designing this trade structure I want to skew the position to the upside by selling the put side of the Iron Condor Spread closer to the current USO price. The call credit portion of the spread will be sold further from price. By structuring the trade in this way, I will maximize the profit potential of this trade and provide some hedging by reducing the total maximum risk per spread by adding the call credit portion of the trade.
Consider the price chart of USO which is shown below. I have highlighted the price range that would be profitable to the August monthly option expiration which would occur at the close on August 15th.
As long as price stays in the range shown above, the USO August Iron Condor Spread would be profitable. This strategy does involve some patience, but if USO prices shot up in a short period of time the trade could be closed for some nice potential profit.
The trade structure I have chosen would have a profit potential of $35 per spread, or a total potential return based on maximum potential risk of 30.43% per spread. The probability based on today's implied volatility in USO options for the entire spread to be profitable at expiration (August 15th) is roughly 72%.
Our new option service specializes in identifying these types of trading setups and helps investors capitalize on consolidating chart patterns, volatility collapse, and profiting from the passage of time.
And if advanced options trades are not for you, we also provide simple option trading setups where we buy either a call or put option based on the SP500 and VIX. The nice thing about buying calls and puts is that you can trade with an account as little as $2,500 with big potential upside.
Join Us Today at: http://www.thetechnicaltraders.com/options


