


A California 9.9 earthquake, Dow Index crash to sub-10,000, gold prices go parabolic, a possible Ebola outbreak in a major US or European city, derivative melt-down, another credit crisis, Ukraine becomes ground-zero for WW III, or maybe politicians "make nice," paper currencies last forever, and there is fresh food and clean water for all.
So many possibilities, often so little clarity, but consider:
-
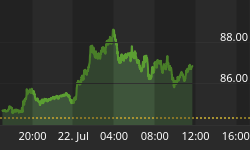
The US stock market hit another all-time high last month and has corrected a few percent. The perma-bulls see a brief correction before new highs. Others see signs of an enduring top. Read the astute article below by Charles Hugh Smith from Peak Prosperity.
-
Ebola is attracting attention - the bad sort of attention that creates panics, craziness, and life changing events. The panic could be far more destructive than the actual disease, which is dangerous.
-
Ukraine is caught in the middle ground between the US and Russia. The first casualty in this war has been the truth. The next casualty might be what little peace remains in Eastern Europe and Asia. Cascading stupidity could escalate and create WW III. Note to politicians: Do not repeat the mistakes of 1914 that created WW I.
Consider the analysis from these other writers and then consider your investment risks and your expectations for consequences in our increasingly unstable world.
Ian's Investment Insights - Special Alert: He makes a good case for the high risk of a major correction in the US stock market, for a turn upward in the HUI (gold stock index), and for a rebound in gold prices.
"I am alerting you to pay attention to this key point reversal top in the U.S. stock markets because it portends a mammoth bear market."
Hathaway - The Next Major Crisis That Will Shock the World:
"So while everyone is cheering the economy on and looking at earnings reports, you have serious trouble brewing. That's what the gold market is sniffing out."
Bill Holter: Could Gold and Silver Go "No Offer?"
Bill makes many good points and discusses what could happen - maybe not tomorrow, but perhaps after the next "big one" that could strike our political or financial systems.
"What I can see happening is a cascade of failures which engulfs all derivatives, debt and currencies. This will create a panicked flight of capital into the safety of gold and silver which will create shortages."
Charles Hugh Smith: Is This Decline the Real Deal? (reprinted with permission from PeakProsperity.com.)

Blueximages | Dreamstime.com
Is This Decline The Real Deal?
Or just another head-fake bear trap?
by Charles Hugh Smith
Is this stock market decline the "real deal"? (that is, the start of a serious correction of 10% or more) Or is it just another garden-variety dip in the long-running Bull market? Let's start by looking for extremes that tend to mark the tops in Bull markets.
Extremes Eventually Revert to the Mean
There's little doubt that current measures of valuations, sentiment, leverage and complacency have reached historic extremes. Many analysts have posted charts depicting these extremes, and perhaps the one that distills well multiple extremes into one metric is Doug Short's chart of the S&P 500's inflation-adjusted Regression to the Trend, another way of saying mean reversion or reverting to the mean.

I have added two red boxes: one around the peak reached just before the Great Crash of 1929 (81% above the trend line), and one around the current reading (86% above the trend line).
That the current reading exceeds the extreme that preceded the Crash of 1929 should give us pause. And little comfort should be taken that the bubble of 2000 reached even higher extremes, as that should likely be viewed as an outlier rather than the harbinger of the New Normal.
What this chart demonstrates is the market tends to overshoot to the upside or downside before reversing direction and once again reverting to the mean. Other than a very brief foray below trend line in 2009, the S&P 500 has been at or above the trend line for the past 20 years. While the Gilded Age boom of a century ago stayed above the trend line for over 30 years, more recent history suggests that markets that stay above the trend line for 20 years are getting long in the tooth.
Extremes in Risk Appetite and "Risk-On" Asset Allocation
One measure of risk appetite is junk bond yields, which as Lance Roberts shows in this chart, have reached multi-year lows:

Money managers' appetite for the "risk-on" asset class of equities is similarly lofty:

Previous readings near the current level preceded major stock market declines -- though high readings have been the norm for the past few years without presaging a major drop.
Can Extremes Be Worked Off Without Affecting Price?
From the Bullish point of view, these extremes have been worked off in relatively mild downturns in the seasonally weak periods of February to April and August to October:
Let's look at a chart of the S&P 500 (SPX), with a focus on the seasonally weak periods:

Rather significant declines in indicators such as the MACD have translated into relatively brief, shallow declines.
From the Bull's perspective, all the extremes in valuations, sentiment, leverage and complacency have been worked off in modest declines that haven't reached the 10% threshold of a correction. So why should the present period of seasonal weakness be any different?
One potential difference in August 2014 is the sheer number of current financial/market extremes. Analyst John Hampson prepared a list of all-time records that is impressively long:
Here are some of the all-time records delivered in 2014:
- Highest ever Wilshire 5000 market cap to GDP valuation for equities
- Highest ever margin debt to GDP ratio and lowest ever net investor credit
- Record extreme INVI bullish sentiment for equities
- Record extreme bull-bear Rydex equity fund allocation
- All-time low in junk bond yields
- All-time low in the VXO volatility index (the original VIX)
- Highest ever cluster of extreme Skew (tail-risk) readings in July
- Highest ever Russell 2000 valuation by trailing p/e
- Lowest ever Spanish bond yields
- Lowest ever US quarterly GDP print that did not fall within a recession
And this week:
- Lowest HSBC China services PMI since records began
- Lowest ISE equity put/call ratio since records began
If we had to summarize the current set of extremes in risk appetite, valuations and sentiment, we might state the Bear case as: These extremes characterize the tops of asset bubbles that inevitably deflate in dramatic fashion, despite the majority of participants denying the asset class is in a bubble.
Conversely, we might state the Bull case as: The fundamentals of low interest rates, abundant liquidity, slow but stable growth and rising corporate profits support current measures of value, confidence and risk appetite.
...
The prudent observer would also ask: Have stocks been pushed to their current valuations by these extremes, or are these extremes merely temporary spikes of exuberance that have little to do with the fundamentals driving valuations higher?
It's a critical question. For if extremes in risk appetite and sentiment have underpinned the market's rise, then as these tides recede, price will inevitably follow.
If these extremes are merely temporary spikes that can dissipate without effecting price, then we have to ask: If this is the case, then what are participants afraid of?
We know participants are afraid of something, because the Put/Call Ratio -- a measure of participants buying hedges (put options) against a downturn -- has skyrocketed to a multi-year high in the past week:

This ratio has traced out a declining channel for the past two years. If nothing fundamental has changed, then what are we afraid of right now?
The Challenge To The Bulls
Those who are confident in the Bull case -- that rock-solid fundamentals will drive stocks higher -- have a daunting task ahead: they need to explain away the obvious spike in fear/caution, and explain why all these extremes in valuations, sentiment, leverage and complacency have no real bearing on the rock-solid fundamentals.
But given that the psychology of bubbles is characterized by precisely this rationalization of why extremes don't matter, Bulls must also explain why their rationalizations don't mark this as the top of an asset bubble that is remarkably similar in terms of extremes to recent bubbles in housing and stocks.
--- end of Charles Hugh Smith article.
Now think of the regression to the mean arguments above and apply them to silver and gold. Note the following chart of silver, the red "mean line" as I have drawn it, the extent that silver prices have fallen below that line, and the over-sold conditions on the monthly chart as shown by the StochD and TDI_Trade_Signal indicators.

Conclusions
Yes, a "big one" could happen. Stocks look over-priced, gold and silver look "beaten down," the global credit and currencies bubbles could implode, global derivatives are a potential disaster zone, and our politicians seem intent on creating distractions, "false flags," and new ways to enrich the military-industrial complex and bankers.
Be careful.


