• 703 days Will The ECB Continue To Hike Rates?
  • 703 days Forbes: Aramco Remains Largest Company In The Middle East
  • 705 days Caltech Scientists Succesfully Beam Back Solar Power From Space
  • 1,104 days Could Crypto Overtake Traditional Investment?
  • 1,109 days Americans Still Quitting Jobs At Record Pace
  • 1,111 days FinTech Startups Tapping VC Money for ‘Immigrant Banking’
  • 1,114 days Is The Dollar Too Strong?
  • 1,114 days Big Tech Disappoints Investors on Earnings Calls
  • 1,115 days Fear And Celebration On Twitter as Musk Takes The Reins
  • 1,117 days China Is Quietly Trying To Distance Itself From Russia
  • 1,117 days Tech and Internet Giants’ Earnings In Focus After Netflix’s Stinker
  • 1,121 days Crypto Investors Won Big In 2021
  • 1,121 days The ‘Metaverse’ Economy Could be Worth $13 Trillion By 2030
  • 1,122 days Food Prices Are Skyrocketing As Putin’s War Persists
  • 1,125 days Pentagon Resignations Illustrate Our ‘Commercial’ Defense Dilemma
  • 1,125 days US Banks Shrug off Nearly $15 Billion In Russian Write-Offs
  • 1,128 days Cannabis Stocks in Holding Pattern Despite Positive Momentum
  • 1,129 days Is Musk A Bastion Of Free Speech Or Will His Absolutist Stance Backfire?
  • 1,129 days Two ETFs That Could Hedge Against Extreme Market Volatility
  • 1,131 days Are NFTs About To Take Over Gaming?
What's Behind The Global EV Sales Slowdown?

What's Behind The Global EV Sales Slowdown?

An economic slowdown in many…

Zombie Foreclosures On The Rise In The U.S.

Zombie Foreclosures On The Rise In The U.S.

During the quarter there were…

  1. Home
  2. Markets
  3. Other

$SPY Chart: Some Institutional Investor Opposition is Starting to Appear

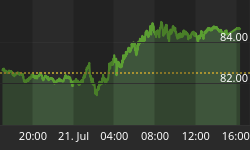
Today's chart that is posted below shows the SPY as of yesterday's close.

I have to tell you that while the SPY's chart is looking good, some Institutional Investor opposition is starting to appear. I don't think there were enough taking this stance yesterday, but it is still a concern.

On to today's chart ...

On the chart, there are thick red and black lines that outline two triangular patterns. The close on the SPY yesterday was above the upper triangle's top resistance line.

Yesterday's tick was strong and trending higher. So the Fed is happy, while some Institutional Investors weren't as happy.

SPY Chart


Back to homepage

Leave a comment

Leave a comment