DOW
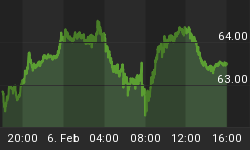
Finally it seems we may just see that new all time high to complete the ending diagonal pattern we have been following for the last few months, more importantly it also seems the DOW has also caught up with the SPX, which is a good thing as it aligns both markets.
SPX
Next week we are likely going to be looking for sell setups once we see a new high, this past week we had to work hard to look for setups on the buy side, the strong downside early in the week again turned most traders bearish, although we had a bullish setup; it met a 1x1 target. The key component that the bears missed was it was still only a 3 wave decline. That should have been raising questions to those that were short to at least cover positions as there was a strong setup to rally to new all time highs again. The bulls again stepped up where they needed to and punish those that outstayed their welcome.
Before
After
This market is punishing those traders that are not prepared to switch their bias, if the market gives a signal, it's been stuck in a range for a few months now and making life hell for swing traders, yet traders that are flexible are the ones making $$.
We still favor new all time highs now for the DOW and SPX, although we could see a pullback, but against last week's low we want to look higher for a new all time high on both markets.
Crude Oil
In last week's report I mentioned that we were looking for a high for wave [4]. It did push a bit higher than I expected but the reversal we saw last week suggests wave [4] is now likely in place and we are going to see more weakness now over the coming weeks. Against 62.57 I favor more weakness now, so readers can look to sell any 3 wave looking bounce against 62.57 stops. If I am correct then a move under $40 should be expected for wave [5].
With the trend line break of price and the RSI, it's a strong setup now to suggest a high is in place, a break under $56.00 - 58.00 would further support the idea of more weakness.
DXY (aka US$)
The US$ could now be poised to resume higher, having declined for a few weeks it still fits the profile of a 4th wave. Ideally last week's low now holds and we see more upside, if we see a strong decline under last week's low I may have to consider the double top scenario and truncated 5th wave, although the decline is deeper than I anticipated, its pulled back to the area of the previous 4th wave at 94.00 so fine for the current wave labeling. What we need to see is a strong upside break of 96.00. That would help the bullish case.
If readers don't want to get involved with the futures market, they can always buy UUP, that's the etf that tracks the US$, if the US$ is set to move higher like I think it can, then we should see a move towards 26.60 over the coming week and put in a 5th wave and complete a 5 wave impulse wave from the May 2014 lows. Below last week's low will suggest we need to adjust and evaluate the idea, so it's got limited risk now.
I will leave it there for this week
Until next time,
Have a profit week ahead.


