• 407 days Will The ECB Continue To Hike Rates?
  • 408 days Forbes: Aramco Remains Largest Company In The Middle East
  • 409 days Caltech Scientists Succesfully Beam Back Solar Power From Space
  • 809 days Could Crypto Overtake Traditional Investment?
  • 814 days Americans Still Quitting Jobs At Record Pace
  • 816 days FinTech Startups Tapping VC Money for ‘Immigrant Banking’
  • 819 days Is The Dollar Too Strong?
  • 819 days Big Tech Disappoints Investors on Earnings Calls
  • 820 days Fear And Celebration On Twitter as Musk Takes The Reins
  • 822 days China Is Quietly Trying To Distance Itself From Russia
  • 822 days Tech and Internet Giants’ Earnings In Focus After Netflix’s Stinker
  • 826 days Crypto Investors Won Big In 2021
  • 826 days The ‘Metaverse’ Economy Could be Worth $13 Trillion By 2030
  • 827 days Food Prices Are Skyrocketing As Putin’s War Persists
  • 829 days Pentagon Resignations Illustrate Our ‘Commercial’ Defense Dilemma
  • 830 days US Banks Shrug off Nearly $15 Billion In Russian Write-Offs
  • 833 days Cannabis Stocks in Holding Pattern Despite Positive Momentum
  • 834 days Is Musk A Bastion Of Free Speech Or Will His Absolutist Stance Backfire?
  • 834 days Two ETFs That Could Hedge Against Extreme Market Volatility
  • 836 days Are NFTs About To Take Over Gaming?
Another Retail Giant Bites The Dust

Another Retail Giant Bites The Dust

Forever 21 filed for Chapter…

What's Behind The Global EV Sales Slowdown?

What's Behind The Global EV Sales Slowdown?

An economic slowdown in many…

  1. Home
  2. Markets
  3. Other

Are Stock Bears Being Too Pessimistic?

Glimmer Of Hope

Monday's widely-followed ISM Manufacturing Index came in above expectations with a reading of 52.8. A reading above 50 indicates growth in manufacturing. A broad recession is typically defined when ISM drops below 43. Therefore, today's figure does not align with the imminent recession theory.


Similar Weak Spot In 2005

As shown in the chart below, recent ISM readings have been trending down. The green box shows ISM rebounded in May 2005 from a level very close to the number released Monday.

ISM Manufacturing


ISM Reading Not Unusual

When ISM was floating around 50 in 2005-2006 and 2011-2014, stocks were able to push higher. Starting with a similar ISM reading, the S&P 500 gained over 29% from May 2005 to the bull market peak in 2007.

$SPX S&P 500 Large Cap Index INDX


Are The Charts Hinting At An Imminent Bear Market?

The economic data has been concerning in recent weeks, but it has not reached "imminent recession" levels. This week's stock market video looks at 2015 versus historical transitions from a bull market to a bear market, allowing us to better understand the odds of a new bear rearing its ugly head.

Video: What Are The Odds A Bear Market Has Already Started?


Investment Implications - The Weight Of The Evidence

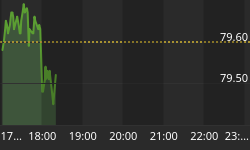
As of Monday afternoon, the S&P 500 remained in an upward-sloping trend channel with a bullish bias. The bears could pick up some short-term momentum with a close below 2064.

$SPX S&P 500 Large Cap Index INDX

The facts and hard evidence we have in hand continue to call for an equity-heavy portfolio. With a monthly employment report and deadlines in Greece still on this week's calendar, we will enter each day with a flexible, unbiased, and open mind.


Back to homepage

Leave a comment

Leave a comment