• 680 days Will The ECB Continue To Hike Rates?
  • 680 days Forbes: Aramco Remains Largest Company In The Middle East
  • 682 days Caltech Scientists Succesfully Beam Back Solar Power From Space
  • 1,082 days Could Crypto Overtake Traditional Investment?
  • 1,086 days Americans Still Quitting Jobs At Record Pace
  • 1,088 days FinTech Startups Tapping VC Money for ‘Immigrant Banking’
  • 1,091 days Is The Dollar Too Strong?
  • 1,092 days Big Tech Disappoints Investors on Earnings Calls
  • 1,093 days Fear And Celebration On Twitter as Musk Takes The Reins
  • 1,094 days China Is Quietly Trying To Distance Itself From Russia
  • 1,095 days Tech and Internet Giants’ Earnings In Focus After Netflix’s Stinker
  • 1,099 days Crypto Investors Won Big In 2021
  • 1,099 days The ‘Metaverse’ Economy Could be Worth $13 Trillion By 2030
  • 1,100 days Food Prices Are Skyrocketing As Putin’s War Persists
  • 1,102 days Pentagon Resignations Illustrate Our ‘Commercial’ Defense Dilemma
  • 1,102 days US Banks Shrug off Nearly $15 Billion In Russian Write-Offs
  • 1,106 days Cannabis Stocks in Holding Pattern Despite Positive Momentum
  • 1,106 days Is Musk A Bastion Of Free Speech Or Will His Absolutist Stance Backfire?
  • 1,107 days Two ETFs That Could Hedge Against Extreme Market Volatility
  • 1,109 days Are NFTs About To Take Over Gaming?
Billionaires Are Pushing Art To New Limits

Billionaires Are Pushing Art To New Limits

Welcome to Art Basel: The…

Zombie Foreclosures On The Rise In The U.S.

Zombie Foreclosures On The Rise In The U.S.

During the quarter there were…

Market Sentiment At Its Lowest In 10 Months

Market Sentiment At Its Lowest In 10 Months

Stocks sold off last week…

  1. Home
  2. Markets
  3. Other

This Past Week in Gold

SPDR Gold Trust Shares Daily Chart
GLD - on buy signal.


IsHares Silver Trust Daily Chart
SLV - on sell signal.


Market Vectors Gold Miners Daily Chart
GDX - on buy signal.


XGD.TO Daily Chart
XGD.TO - on buy signal.


Central Fund of Canada Daily Chart
CEF - on buy signal.


US Dollar Index Daily Chart

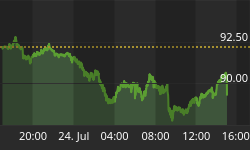
USD - the multi month correction may be over soon as prices finally reached the 200ema support this week. A rising dollar is not friendly to the metals.

Summary
Long term - on major sell signal since Mar 2012 when $HUI was at 550.
Short term - on mixed signals.
Gold sector cycle - down as of 8/28.
Traders can play for short term bounces.


Back to homepage

Leave a comment

Leave a comment