


Trepidation about the first U.S. rate hike in almost a decade added to worries among investors already on edge about a stumbling Chinese economy and a recent market selloff. "One of the biggest problems we face is that there is no historical template for current global market conditions so we're all flying blind to a large degree," said Deutsche Bank credit strategist Jim Reid. "Never before have so many of the most important countries in the world printed so much money and left base rates so low for so long."
Another brutal week for the main equity indexes, which suffered their second-largest weekly losses this year. September kicked off on Tuesday with a massive 3% drop. Markets managed to rally back, but they are still in a tough spot with near-term bear trends in place. September 1st result was among the worst in history as 499 of the S&P 500 components closed negative. Granted there are now 502 stocks in the S&P 500, but that is still the 2nd worst reading going back to 1996. The only higher reading was on 8/8/11, which saw 500 stocks down. For the week, the S&P 500 Index fell 3.4% and the Blue Chip-heavy Dow Jones Industrial dumped 3.2%. The Nasdaq was down 3.2% and the small cap Russell 2000 fell only 2.3% as they have less exposure to China's woes.

A tool to help confirm the overall market trend is the Bullish Percent Index (BPI). The Bullish Index is a popular market "breadth" indicator used to gauge the internal strength/weakness of the market. It is the number of stocks in an index (or sector) that have point & figure buy signals relative to the total number of stocks that comprise the index (or sector). So essentially it is the percentage of stocks that have buy signals. Like many of the market internal indicators, it is used both to confirm a move in the market and as a non-confirmation and therefore divergence indication. If the market is strong and moving up, the BPI should also be moving higher as more and more stocks are purchased. The orange box in the chart below confirms the S&P 500 is converting into a range-bound trend. The other major equity index BPI charts have a similar setup.

A standard chart that we use to help confirm the overall market trend is the Momentum Factor ETF (MTUM) chart. Momentum Factor ETF is an investment that seeks to track the investment results of an index composed of U.S. large- and mid-capitalization stocks exhibiting relatively higher price momentum. This type of momentum fund is considered a reliable proxy for the general stock market trend. We prefer to use the Heikin-Ashi format to display the Momentum Factor ETF. Heikin-Ashi candlestick charts are designed to filter out volatility in an effort to better capture the true trend. The orange box in the chart below is another technical indicator pointing toward a relatively wide trading range. Also note the strength and momentum indicators signal a neutral trend.

Recently we said "...the MTUM is displaying technical reversal signals at its 50 Week SMA. Notice how every time the ETF falls to the SMA it recoils higher..." As circled in the chart below, the weekly MTUM is at the 50-Week SMA. If we get a confirmed break below this level it will signal the longer term bullish trend is breaking down. If the bullish trend breaks there is no firm market support and stocks will be in free fall.

Market Outlook
August ended with more than a 5% loss on the S&P 500, the worst performance for the month in 17 years and down 7.5% from its July high. According to Jason Goepfert at SentimenTrader, after August losses of this magnitude since 1928, September sported a positive return only 4 out of 13 times, posting an average loss of 5.4 percent. When they rallied, stocks only rose above August's close by an average of 1.4 percent. When they fell, the drop averaged 8.3 percent. In his words, that's the data reveals a "terrible risk/reward ratio" in stocks right now. September is historically the worst month for markets, though compared with this August's turmoil; September's average 1.1% drop in the S&P 500 seems tame.
A decade of near-zero interest rates has helped the U.S. stock market stage a spectacular bull run since the financial crisis and investors are worried those gains many end once rates start to climb. "One of the biggest problems we face is that there is no historical template for current global market conditions so we're all flying blind to a large degree," said Deutsche Bank credit strategist Jim Reid. "Never before have so many of the most important countries in the world printed so much money and left base rates so low for so long." Critics say the ultra-low rate is no longer helping growth but is feeding excessive speculation and overly high prices in asset markets, and threatens to spark a burst of inflation. The latest round of market turbulence doesn't look like the start of an extended bear market as long as underlying U.S. economic data continues to strengthen. The strength of the economy right now is in the auto, housing and construction sectors, again areas insulated from global factors. China's effect on the domestic economy is likely to unfold slowly compared to the effect on the nation's exports.

The dollar finished the week on uneven footing, posting its second straight weekly gain against the euro, while weakening against the yen after Friday's closely watched jobs report delivered a hazy picture of the U.S. labor market. Expectations of a September rate hike by the Fed have waned as a slowdown in China has brought increased market volatility across asset classes, causing the U.S. dollar's rally of the past year to wane. Treasury bonds finished higher after the Labor Department said the U.S. economy added 173,000 jobs in August, the smallest gain in five months. This report disappointed some market strategists, who had expected Friday's report to clarify whether or not Federal Reserve policy makers might raise interest rates in September. The fueled demand for long-term Treasury bonds while short-term notes sold off on Friday. Later in the day, the rally intensified in the long-term maturities, pushing prices higher and driving the 10-year yield to its lowest level since Aug. 24, the day when the stock market suffered its biggest drop in four years (Treasury prices rise when yields fall). Gold futures settled at their lowest level in more than two weeks on Friday, tallying a weekly loss of 1.1% in the wake of the monthly U.S. jobs report, which offered a mixed picture of the health of the U.S. labor market. Looking ahead to next week, investors should expect more volatility in the gold market, said Robert Barone, a principal of Universal Value Advisors. Volatility will continue until the Fed meeting, he said.

We like to compare the DOW Industrials and Transports to confirm the current market trend. The trading ranges for both the DOW Industrials and Transports are contained within the orange box in the chart below. This signals further confirmation that the major indexes will continue fluctuating in a wide trading range.

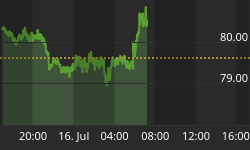
The CBOE Volatility Index (VIX) is known as the market's "fear gauge" because it tracks the expected volatility priced into short-term S&P 500 Index options. When stocks stumble, the uptick in volatility and the demand for index put options tends to drive up the price of options premiums and sends VIX higher. Last week we said, "...Investors can expect the volatility to continue because it normally increases in September and October after the summer doldrums..."

The dotted line in the daily chart below denotes the current VIX support level. Uncertainty is prevalent in the markets as Option Volatility remains at historically high levels. You can see the VIX is trending at an elevated level that indicates investors anticipate high near term volatility. The current trend points to continued daily triple-digit price fluctuations. In recent years whenever the VIX got near $20 it would eventually sell off. Downside fear has finally taken root, which is keeping the VIX higher.

Put/Call Ratio is the ratio of trading volume of put options to call options. The Put/Call Ratio has long been viewed as an indicator of investor sentiment in the markets. Times where the number of traded call options outpaces the number of traded put options would signal a bullish sentiment, and vice versa. Technical traders have used the Put/Call Ratio for years as an indicator of the market. Most importantly, changes or swings in the ratio are seen as instances of great importance as this is commonly viewed as a change in the tide of overall market sentiment. Our recent analysis remains valid "...the Put/Call Ratio has predominately remained excessively bearish as traders invested in put contracts to protect against a downtrend..." Option premium is at high levels as traders buy protection during the market slide.

The American Association of Individual Investors (AAII) Sentiment Survey measures the percentage of individual investors who are bullish, bearish, and neutral on the stock market for the next six months; individuals are polled from the ranks of the AAII membership on a weekly basis. The current survey result is for the week ending 9/02/2015. The most recent AAII survey showed 32.40% are Bullish and 31.70% Bearish while 35.90% of investors polled have a Neutral outlook for the market for the next six months. The current survey results point to a continued up and down fluctuating trading environment.

The Nation Association of Active Investment Managers (NAAIM) Exposure Index represents the average exposure to US Equity markets reported by NAAIM members. The blue bars depict a two-week moving average of the NAAIM managers' responses. As the name indicates, the NAAIM Exposure Index provides insight into the actual adjustments active risk managers have made to client accounts over the past two weeks. The current survey result is for the week ending 9/02/2015. Second-quarter NAAIM exposure index averaged 72.84%. Last week the NAAIM exposure index was 28.31%, and the current week's exposure is 23.85%. The equity exposure reading continues to make all-time lows. Most traders are due back from vacation next week, which should contribute to the higher volatility that normally occurs in September. Even as traders return to their desks, equity exposure probably won't increase much ahead of the next FMOC meeting in a few weeks.

Trading Strategy
The current market environment remains a day-traders nirvana as they have programmed algorithms to sell into rallies. Among the biggest losers this week were utilities stocks, which shed 5.2%, while health-care and financials stocks lost 4.4% and 4.3% respectively. If you learn how to identify support and resistance levels and you understand trends and how indexes trade within, then you will understand how to handle this market and not to be paralyzed by fear and anxiety. People like trading to be exciting but most often; successful trading is a waiting game that pays positive returns when patient. Remain defensive, and use any celebrations on Wall Street to buy puts and other forms of insurance more cheaply. Now is an opportune time to reflect on your longer-term investments and to get rid of any underperformers. We also recommend opening covered calls on any stocks that you do want to own for the longer term.

Feel free to contact me with questions,


