


Two years ago we saw the exact same symmetrical triangle setup in gold as we see now. Below we show you the ABCDE consolidation pattern and the targeted breakout. Rarely does the market conform so well as it does with symmetrical triangles.
Note in the chart below that gold spent the first half of 2003 consolidating in a wide triangle pattern. Seasonal trends in the dollar are bullish for the first half of the year and bearish in the second half. With US interest rates at a paltry 1%, the use of the dollar as a funding currency meant that the "carry trade" was stamped with a "Made in the USA." In fact, dollars are still our biggest domestic export!

Traders love symmetrical triangle breakouts for three reasons. First is that that 75% of breakouts are in the direction of the prevailing trend and you can wait for confirmation of the breakout before acting. This puts the risk/reward ratio in your favor.
Second is that a targeted move is very clearly defined as a measured move from the base of the triangle transposed to the breakout level. That allows a trader to maximize his profit potential.
Third is that triangle breakouts often signal the end of a move. Therefore, it is no coincidence that triangle breakouts are often "wave 4" moves in Elliott Wave theory with a final thrust in "wave 5."
While you can spot one of these moves each week in the currency markets, we prefer to trade the "big breakouts" as this allows us to leverage into a move while moving up our trailing stops. As such, we can very often make a confident forecast and take profits near the top.
On July 31, we wrote in our weekly recap on the markets, "Longtime readers may recall that we called for a decline in gold to $375 by August to coincide with a decline in the euro to 1.17/20 and top in USDX at 92. Instead, the yearlong consolidation around last year's peak at $425 "looks" like a correction. If so we cannot exclude the possibility that this is a developing "ABCDE" triangle, implying higher prices from August to December, which is the seasonally bullish period. Only a move below $418 in the coming weeks would negate this view."
One month later in our August 21 issue we wrote, "Note how EVERYONE bought into the "ABCDE" triangle breakout in gold last week right at the highs. The last time hedge funds were this long was April 2004, which then saw a $50 dollar slide in six weeks. This is NOT a good sign for further upside in gold if historical trends in COT data are any guide. As such, we are long USD from Monday and have a small long gold position from $438 with stops at $420."
Note that we were willing to play both the long side in gold and the US dollar. This is a big change from two years ago when we would have been strictly short US dollars on a breakout in gold. The reason is simply that the interest rate advantage of holding the dollar at 3.75% is as strong as was the case to sell it in 2003 when it returned only 1.0%.
Subscribers know that we rolled out of long gold positions early and then waited for a larger pullback in the dollar in September that never happened. That meant we sat on the sidelines watching a simultaneous rally in gold and the dollar. Despite that minor setback we think we know what is in store for the dollar following gold's rally to our target of $480 today.

In this morning's commentary on gold we wrote to subscribers the following:
Last week we wrote, "Considering that gold is rallying in a final "wave 5" this week, a peak in gold prices would coincide perfectly with the beginning of a "wave 3" rally in the US dollar index."
Readers will recall that we gave two target levels for the breakout in gold. The first was $480 and the second was for $490-$500.
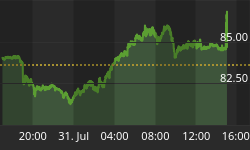
Spot gold reached our first target which was the measured move of the base of the triangle from last year's high at $457 to this year's low of $410. The measured move of $47 from the breakout level at $433 gives a target of $480.
Today's bearish daily reversal off of a very obvious target means that gold should now target the equally obvious support level at $460 where traders who remain bullish should look to reestablish longs.
However, we must note that breakout has followed what appears to be a very clear "five wave" move. If so, then a deeper retracement back to the apex of the triangle formation at $422 is expected.
So, traders have a very clear price target and objective. One could sell spot gold today at $475 with risk above $480 or look to buy at $457 with stops just below here.
We trade only the dollar, but look for clues in both precious metals and the currency markets to confirm or deny our forecast in the dollar index. Therefore, the fact that the dollar has held above the 38.2% Fibonacci Fan line from the 2002 highs just as gold is completing a "wave 5" peak suggest to us that as we said last week, a "wave 3" rally in the US dollar index is now expected.
In conclusion, because the measured move in gold is now complete and the fact that the dollar pays a hefty premium over the euro we feel that the next big move in currencies will be a dollar rally.


