


The main indexes booked a fourth straight weekly gain with the majority of gains coming over the Thursday and Friday trading sessions after a surprise interest-rate cut from the People's Bank of China and a string of better-than-expected earnings from heavyweight tech companies. The S&P 500 gained 2.1% over the week and finally turned positive for the year. The Dow Jones Industrial Average ended the week with a 2.5% gain. The Nasdaq Composite advanced 3% over the week, its strongest weekly advance since July. The small cap Russell 2000 index was actually flat for the week. Year-to-date, the S&P 500 index is now up .8%, the Dow is down 1%, and while the Nasdaq up 6.3%.

A tool to help confirm the overall market trend is the Bullish Percent Index (BPI). The Bullish Index is a popular market "breadth" indicator used to gauge the internal strength/weakness of the market. It is the number of stocks in an index (or sector) that have point & figure buy signals relative to the total number of stocks that comprise the index (or sector). So essentially it is the percentage of stocks that have buy signals. Like many of the market internal indicators, it is used both to confirm a move in the market and as a non-confirmation and therefore divergence indication. If the market is strong and moving up, the BPI should also be moving higher as more and more stocks are purchased. Last week's comment "...The market will probably need to absorb this overbought condition before the prices break above the trading range..." In the updated chart below the S&P 500 Bullish Percentage Index (BPSPX) has broken out above the top its trading range. As noted, conditions are extremely overbought, though this situation can persist indefinitely, but a price pullback will help resolve this overhang so that stocks can end the year higher.

In the chart below, the Aggregate Bond ETF (AGG) represents the "bond" market and the Equal-Weight S&P 500 ETF (RSP) is the stock market benchmark. Investors are starting to selloff bonds to finance stock purchases. As long as the Federal Reserve maintains its "zero" interest policy, bond price will remain elevated. But later this year or early next year rates will have to rise, and this will probably send bond prices tumbling.

A standard chart that we use to help confirm the overall market trend is the Momentum Factor ETF (MTUM) chart. Momentum Factor ETF is an investment that seeks to track the investment results of an index composed of U.S. large- and mid-capitalization stocks exhibiting relatively higher price momentum. This type of momentum fund is considered a reliable proxy for the general stock market trend. We prefer to use the Heikin-Ashi format to display the Momentum Factor ETF. Heikin-Ashi candlestick charts are designed to filter out volatility in an effort to better capture the true trend. Last week we observed, "...the recent market uptrend is converting into a flat trading range...analysis suggesting a relatively narrow, trading range..." The updated chart below highlights the top of the current trading range. It appears the MTUM is setting up to break out of the range into a new uptrend.

Market Outlook
As reported by Mark Hulbert in MarketWatch, they anticipate that the Halloween Indicator will be especially kind to the stock market for the end of the year. The Halloween Indicator already carries decent odds of success. But since the stock market is on the uptrend heading into Halloween, including another 200+ point rally in the Dow Jones Industrial Average this past week, the odds become even better. The Halloween Indicator refers to the stock market's seasonal tendency to produce its best returns between Halloween and May Day (the so-called "winter" months). This indicator is also known as "Sell in May and Go Away," since those who mechanically follow it invests in to cash during the "summer" months (from May Day until the subsequent Halloween). Notice from the chart below that the Indicator worked like a charm over the last year. Over the seasonally favorable six-month period that began on Halloween 2014, the Dow gained 2.6% versus a loss of 2.6% in the unfavorable summer months that began last May Day. In fact, this tendency has been stronger over the last 15 years than it was before. These impressive statistical odds become even better when the stock market is able to buck the seasonal odds and eke out a gain over the September-October period, the last two months of the seasonally unfavorable summer period. That's exactly what's happened this year, with the Dow currently 5% higher than where it stood at the end of August.

Since August's lows have held, the longer-term trend is still bullish and that is the likely direction the market will go this fourth quarter. Strong quarterly earnings from several big-name technology companies are stimulating the current market rally, which has been gradually regaining ground following a swoon in August and September. The Energy sector is leading the fourth-quarter after recovering from recent lows. Investors also were thrilled with an interest rate cut by China's central bank and the possibility of more economic stimulus for Europe. "Both of those were positive and begin to lift the cloud of uncertainty which drove the volatility in the third quarter," said Michael Baughen, global investment specialist at J.P. Morgan Private Bank. Next week, the spotlight shifts to the world's other big central banks, the U.S Federal Reserve and the Bank of Japan, which are holding policy meetings at which officials will probably consider the ECB's intentions into their own outlooks. While only about a quarter of the companies in the S&P 500 index have reported results this earnings season, the market has seen some encouraging signs so far. "There are just hints everywhere that things might not be in the dire situation we were all thinking it was a month ago," said, JJ Kinahan, TD Ameritrade's chief strategist.

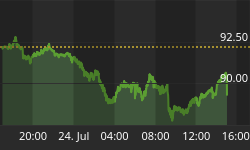
The U.S. dollar posted its largest weekly gain against since late May on Friday, supported by interest-rate cuts in China and the promise of more stimulus in Europe. This supports the dollar because investors are betting that the Federal Reserve will raise interest rates this month or next, while other central banks across the globe are maintaining or expanding easy-money policies. Higher interest rates in the U.S. would increase the return on dollar-denominated deposits, making them more attractive for foreign investors. As circled in the chart below, Treasury and Gold prices fell Friday, after China's central bank decision to cut interest rates helped extend a global stock market rally. The dovish central-bank move fueled a "risk-on" trading, leading investors to sell government bonds and precious metals in favor of stocks. Gold fell to the lowest level in two weeks on Friday, as a stronger U.S. dollar pushed prices to their largest weekly loss since August.

As mentioned above, higher interest rates in the U.S. increase the return on dollar-denominated deposits, making them more attractive for foreign investors. Investors reasoned that, even though the Federal Reserve might delay its first interest rate hike until 2016, monetary policy across the globe would continue to focus on easy money policies. "Markets see little likelihood of liftoff at the October FOMC meeting next week, but the post-meeting statement will be scrutinized for clues about a potential hike in December," a Goldman Sachs report said on Friday. Generally, the dollar has an inverse relationship to commodities. In the chart below you can see that as the dollar is surging higher, the commodity index (CRB) is in freefall.

We like to compare the DOW Industrials and Transports to confirm the current market trend. As circled in the updated chart below, the DOW Industrials and Transports have synched up to provide confirmation of the current bullish move.

The CBOE Volatility Index (VIX) is known as the market's "fear gauge" because it tracks the expected volatility priced into short-term S&P 500 Index options. When stocks stumble, the uptick in volatility and the demand for index put options tends to drive up the price of options premiums and sends VIX higher. Last week we observed, "...It is reasonable to expect the VIX to continue heading downward while the S&P index creeps higher..." The CBOE Volatility Index (VIX) fell just over 3% this past week to even lower levels due to the October rally in equities.

Last week's analysis said, "...the VIX is in a confirmed downtrend with bearish momentum... the Volatility Index continues to crash in a confirmed downtrend with more room to fall..." As highlighted in the weekly chart below, the Volatility Index displays strong downward momentum. Expect the VIX to continue falling toward its long-term support level, which is around $12.50.

Put/Call Ratio is the ratio of trading volume of put options to call options. The Put/Call Ratio has long been viewed as an indicator of investor sentiment in the markets. Times where the number of traded call options outpaces the number of traded put options would signal a bullish sentiment, and vice versa. Technical traders have used the Put/Call Ratio for years as an indicator of the market. Most importantly, changes or swings in the ratio are seen as instances of great importance as this is commonly viewed as a change in the tide of overall market sentiment. As we have been saying recently, "...traders continue buying calls to place bets during quarterly earnings season. This allows traders to make bullish trades and minimize risks with a limited capital outlay..." The trend is continuing toward excessive levels, as it appears traders are using call options as a stock replacement strategy.

The American Association of Individual Investors (AAII) Sentiment Survey measures the percentage of individual investors who are bullish, bearish, and neutral on the stock market for the next six months; individuals are polled from the ranks of the AAII membership on a weekly basis. The current survey result is for the week ending 10/21/2015. The most recent AAII survey showed 34.80% are Bullish and 24.00% Bearish, while 41.20% of investors polled have a Neutral outlook for the market for the next six months. We recently said, "...the current AAII survey signals moderately higher market prices..." Individual investors remain underinvested compared to historical norms. As a reliable contrarian indicator, this signals the stock market should keep moving higher.

The Nation Association of Active Investment Managers (NAAIM) Exposure Index represents the average exposure to US Equity markets reported by NAAIM members. The blue bars depict a two-week moving average of the NAAIM managers' responses. As the name indicates, the NAAIM Exposure Index provides insight into the actual adjustments active risk managers have made to client accounts over the past two weeks. The current survey result is for the week ending 10/21/2015. Third-quarter NAAIM exposure index averaged 56.15%. Last week the NAAIM exposure index was 44.27%, and the current week's exposure is 35.00%. We are a little surprised the NAAIM Exposure index pulled back after reaching its highest percentage since the beginning of August last week. Obviously, a significant number of professional money managers remain skeptical about the strength of the current bullish move. This suggests there is some cash on the sidelines waiting to be deployed. The Federal Reserve Committee meets next week and if they continue to maintain a dovish position, expect NAAIM members to get on board and increase their equity exposure.

Trading Strategy
Last week we noted "...this is the S&P 500's best October start since 2011 and good enough to be the eighth best start since 1950. Historically when the first nine trading days of October produced a gain, full month October finished with a gain 78.5% of the time..." This analysis is playing out as advertised as this October is on track for one of the historically best performing months for the stock market. In the updated graph below, over the past month, 9 of the 10 major S&P sectors exploded higher. Healthcare remains the only lagging group. We expect the a bullish trend to continue for the rest year so that continuing to moderately increase bullish bets makes the most sense to us. Especially as quarterly earnings season progresses, solid numbers should continue to boost stocks. Michael Arone, chief investment strategist for State Street Global Advisors' U.S. intermediary business, said "it is encouraging to see solid earnings results from tech, consumer discretionary and health-care companies,"

Feel free to contact me with questions,


