• 678 days Will The ECB Continue To Hike Rates?
  • 678 days Forbes: Aramco Remains Largest Company In The Middle East
  • 680 days Caltech Scientists Succesfully Beam Back Solar Power From Space
  • 1,080 days Could Crypto Overtake Traditional Investment?
  • 1,085 days Americans Still Quitting Jobs At Record Pace
  • 1,087 days FinTech Startups Tapping VC Money for ‘Immigrant Banking’
  • 1,090 days Is The Dollar Too Strong?
  • 1,090 days Big Tech Disappoints Investors on Earnings Calls
  • 1,091 days Fear And Celebration On Twitter as Musk Takes The Reins
  • 1,093 days China Is Quietly Trying To Distance Itself From Russia
  • 1,093 days Tech and Internet Giants’ Earnings In Focus After Netflix’s Stinker
  • 1,097 days Crypto Investors Won Big In 2021
  • 1,097 days The ‘Metaverse’ Economy Could be Worth $13 Trillion By 2030
  • 1,098 days Food Prices Are Skyrocketing As Putin’s War Persists
  • 1,100 days Pentagon Resignations Illustrate Our ‘Commercial’ Defense Dilemma
  • 1,101 days US Banks Shrug off Nearly $15 Billion In Russian Write-Offs
  • 1,104 days Cannabis Stocks in Holding Pattern Despite Positive Momentum
  • 1,105 days Is Musk A Bastion Of Free Speech Or Will His Absolutist Stance Backfire?
  • 1,105 days Two ETFs That Could Hedge Against Extreme Market Volatility
  • 1,107 days Are NFTs About To Take Over Gaming?
  1. Home
  2. Markets
  3. Other

Elliott Wave Analysis On EURJPY And NZDUSD

EURJPY

EURJPY is trading in consolidation and if the choppy pullback continues to proceed to lower levels we might look for a potential entry on this pair. Since we expect one more wave up on EURUSD, we might see a possible impulse after this complex correction is over. Here again we have to look what will have the most effect on this cross, USDJPY or EURUSD since they often change.
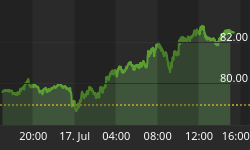
EURJPY, 1H

EURJPY 1-Hour Chart


NZDUSD

On the larger time frame of NZDUSD, we see price trading in a correction in black wave IV. Fourth waves might drag in time and make things complicated, as price moves slow and choppy. We are probably in the long range triangle, now trading in wave C, that could be near completion. That said the triangle correction will be completed, after waves D and E unfold. When the triangle correction is completed, we expect prices to continue to lower levels.

NZDUSD, Daily

NZDUSD Daily Chart


If you like our trading analysis, you can visit our website at --> www.ew-forecast.com


Back to homepage

Leave a comment

Leave a comment