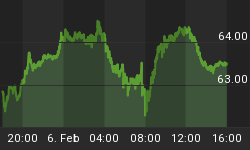
This week will very likely be one we look back on as a big inflection point. We will see that the bears are coming back.
It appears the market is forming a head and shoulders topping pattern. There are a couple different ways to trade this pattern depending on the level of skill and aggressiveness.
One can wait for a closing bar below the 'neckline' on the time-frame in which you have identified the pattern. By operating on a closing bar basis you significantly reduce the risk of entering on a 'false' breakout. Entering prior to the close of the bar increases the risk of becoming part of the wick of a reversal candlestick should it close back above 'neckline' support.
Another way is to try and time the right shoulder and short into the bounce or pause just before you think a neckline break is about to occur.
Both, have then pro's and con's, which is better, that all depends on the overall market conditions and that of the trader making the trade.
Take a look a couple charts below so you can see where I feel the stock market is within this pattern.
iViewMarkts.com Bullish Sentiment Indicator: This shows active traders have been very bullish and are just now starting to become bearish. As more short term traders start to sell their long positions and build up short positions this will put downward pressure on stocks and likely start the new trend down.

SP500 Bullish Percent Index: This chart is telling us more stocks are starting to form bearish price patterns after being overbought the last couple months.

Head & Shoulders Pattern: This is the pattern I speak of showing where most traders enter positions for this price pattern. There is always a possibility that the market does not do a Kiss goodbye (retest of breakdown). The strongest moves to the downside will not retest the breakdown in most cases so playing the breakdown I think is vital.

SP500 Head & Shoulders Pattern:

That is a quick snapshot of the market and where it stands...
Get My Trade Alerts In Real-Time: www.TheGoldAndOilGuy.com


