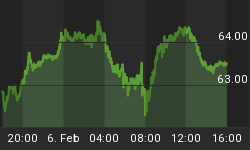
Currently, a 'sharp fall' is now anticipated within the equity markets! This decline will be accompanied with 'new volatility'. There is a great deal of 'uncertainty 'within the U.S. markets. Currently, we are viewing a 'textbook' 'head and shoulders pattern' in the SPX and is going to be a big inflection point we look back on months from now.
There are less and less stocks that are participating in the recent move upwards which suggest a technical breakdown is likely to happen.

The 'cycles' of the SPX have recently confirmed that we have now witnessed the 'highs'. The 'top' is currently in place and I expect that the 'negative trend' will continue to persist.
See my live analysis charts and forecast click here
The 'smart money' has been exiting the equity markets during the last few weeks with strong waves of selling volume taking place on a consistent basis.
Yesterday morning, Monday, May 16th, 2016, I alerted my subscribers to two new positions to enter into so as to take advantage of during this next significant market move and change in volatility.
Consequently, consumers have already started to slow down in their spending. They will change their past behavior, and, as a result, will begin to save (whatever funds that they may still have) as stocks start to fall in value along with the average investors retirement accounts. The present day spending behavior will come to a grinding halt in due time!
Before "The Great Credit Crisis of 2007-2008", the 'smart money' exited the equity markets in November of 2006. And it appears that the NDX-100 and the Russel 2000 are leading the 'charge' downward once again for the pending market correction.
We are, once again, repeating this same technical pattern, now!

Concluding Thoughts:
In short, the first chart I showed in this article paints a very clear picture of where stock prices are headed - Lower.
Large cap stocks over the past year have been making lower lows and lower highs. The most novice of traders knows what that means... It means, we are in a down trend.
There are many ways to take advantage of what is about to unfold next, but how you play it really depends on how much money you have to play with and the level of risk tolerance you have.
I share a few ways I am taking advantage of this with followers of my newsletter at: www.TheGoldAndOilGuy.com


