


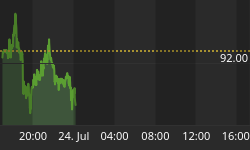


LET'S LOOK AT THE FTSE 100 DAILY CHART

Last week it again looked like the index was going to continue the struggle and the light volume left the index vulnerable to a sharp decline, which did occur. This can get serious if it continues to struggle. There is now a complete wave structure or complete leg up. In order to prove there is another leg up there needs to be a low on top of the high of the 28 th. There are two timing points this week that could set up the timing for the index into January. Monday the 5 th and Thursday the 8 th are both important. If one turns out to be a significant turning point for the index it will give us a valid look into the future. But for now it still looks like a struggle upward.
LET'S LOOK AT THE S&P 500 INDEX-DAILY CHART FIRST

Last week I indicated the index had exhausted at the 1270 high as forecast and would consolidate that fast move up and likely test the old "Obvious" high. I was correct about the exhaustion but the index fell 5 points short of the old high. As discussed last week this is the most critical part of this trend. Will it form a top below 1277 to 1283 or will it follow the price movement of the 20 and 60-year cycles?
NOW LET'S LOOK AT THE 60 YEAR CYCLE AGAIN

If we are following the long-term cycles the index is either at point "A" or "B" or it is now building a top as occurred in the 1946 top. The pattern at the 1946 top is something that the FTSE could repeat if the trend doesn't resume within the next two weeks.
CRUDE OIL DAILY CHART

Wednesday last week on my internet report I gave up on the downtrend in oil. This is really good instruction on technical analysis and you WON'T find this written in any book. Notice the last thing on the chart was a two bar rally that was follow by a 4 bar decline. Whenever a market takes twice the time to go the same distance in a specific circumstance it can signal the end to a trend. The only key is to be able to identify the circumstance. That circumstance is after there are three clear drives in the direction of the trend. That was obvious and therefore the leg down is complete. It doesn't mean the downtrend is complete if there are other legs down. But it does indicate this leg is complete and a rally of some significance could occur. Since the high to low time was very close to 90 days this entire move down could be a counter trend. If I am wrong Monday will be a high and a new low will occur within two days.
This rally will either be a move between 7 to 12 trading days and due to the 90 day time period it could go on longer. The rally is at a ¼ retracement but that seems unlikely considering the complete wave structure down and the way it eased into the low. A 3/8 retracement is above 61.25 is more reasonable and if that is exceeded in most contracts then a resumption of the up trend should be considered. Again I doubt that scenario but I need to let the market show me this rally before coming to a conclusion.
CNBC ASIA
HANG SENG

The two week we had determined the index had successfully put in a base and was going to run to the old high from that low. We could also assume any correction or counter trend would not exceed 4 days until that price objective was hit and the last correction was 2 days. Friday's large gap up may need to be consolidated but I don't see why it shouldn't test the highs. The next cycle date of any consequence is the 12 th of December.
LET'S LOOK AT THE AUSTRALIAN ASX 200 INDEX

Last week I set up the possibility the index would break the previous low from the two- day move down and recover the next day for a low. Thursday the index went to a new low and the next day recovered. This brought the index down to a ¼ retracement and holds the trend in a strong position for the next rally. So the index needs to hold that low this week and rally. If it doesn't hold this level then the ASX 200 is going down to 4505 to 4492. If that occurs it will change the character of the trend and leave a probability of struggling into a top within the next two months.
LET'S TAKE A LOOK AT THE GOLD MONTHLY CHART-

This last drive up can only be viewed as an exhaustion phase of a trend. You can judge that circumstance by the distance the market is pulling away from the trendline as a movement becomes vertical. You can also see the two previous highs in the December contract the first is at 520, these could be tested. This is an exhaustion move up and is easy to see by the vertical nature of the move. The first time the market moves down more than 4 days it will likely signal the end of the exhaustion phase. Blowoff legs tend to be 90 day blocks in time and one of those just expired. The next really significant timing is not until the first of February and this seems a bit frothy to reach that point in time. So I don't have a good time for this to end, yet. This type of trend will exhaust into the high and I'll report that circumstance as soon as it materializes. But for now this is in an exhaustive mode, we'll look at the daily chart next week.
COPPER

Copper is in the same circumstance. This is a trend that is exhausting and this is what trends do. This is not unusual and occurs every few decades. The next 90-day block in copper is December 15 th so we'll need to see how the market acts around that date. That will present a probability for top. But as with Gold when this market breaks back more than 4 days it will indicate the index has exhausted and the top is in place and we will look for the next rally to produce a counter trend or lower high. And that is very close due to the vertical nature of this movement. The Nikkei is in the same situation.


