• 817 days Will The ECB Continue To Hike Rates?
  • 817 days Forbes: Aramco Remains Largest Company In The Middle East
  • 819 days Caltech Scientists Succesfully Beam Back Solar Power From Space
  • 1,219 days Could Crypto Overtake Traditional Investment?
  • 1,224 days Americans Still Quitting Jobs At Record Pace
  • 1,226 days FinTech Startups Tapping VC Money for ‘Immigrant Banking’
  • 1,229 days Is The Dollar Too Strong?
  • 1,229 days Big Tech Disappoints Investors on Earnings Calls
  • 1,230 days Fear And Celebration On Twitter as Musk Takes The Reins
  • 1,232 days China Is Quietly Trying To Distance Itself From Russia
  • 1,232 days Tech and Internet Giants’ Earnings In Focus After Netflix’s Stinker
  • 1,236 days Crypto Investors Won Big In 2021
  • 1,236 days The ‘Metaverse’ Economy Could be Worth $13 Trillion By 2030
  • 1,237 days Food Prices Are Skyrocketing As Putin’s War Persists
  • 1,239 days Pentagon Resignations Illustrate Our ‘Commercial’ Defense Dilemma
  • 1,240 days US Banks Shrug off Nearly $15 Billion In Russian Write-Offs
  • 1,243 days Cannabis Stocks in Holding Pattern Despite Positive Momentum
  • 1,244 days Is Musk A Bastion Of Free Speech Or Will His Absolutist Stance Backfire?
  • 1,244 days Two ETFs That Could Hedge Against Extreme Market Volatility
  • 1,246 days Are NFTs About To Take Over Gaming?
  1. Home
  2. Markets
  3. Other

Elliott Wave Analysis: GBPUSD And Crude OIL

GBPUSD

Cable moved sharply higher today, straight up to 1.2700 which looks like a wave 3 of an impulsive structure. Pair is trading close to 261.8%, so we need to be aware of a short-term corrective set-back down into wave 4 in the near-term. Invalidation level is now at 1.2526; as long it holds trend is up.

GBPUSD, 1h

GBP/USD 1-Hour Chart


Crude OIL

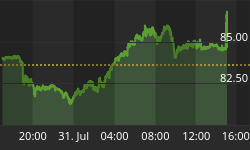
Crude oil is trading sharply higher, now breaking above one important channel line which may suggest that energy is in the middle of a big wave three. However, on hourly chart below we see small five waves up from 45.00 area so it may be a time for a short-term pullback; ideally back in wave 2 that will either look for a support at that broken trendline or at 49.14 level. Technically speaking, oil is in bullish mode at this stage, but trend would be changed again if price would go back below $48 per barrel.

Crude OIL, 1h

Crude Oil 1-Hour Chart


Interested in our services? Then visit our homepage at www.ew-forecast.com and take a glace at some of our charts. You can even subscribe to our Twitter account -> @ewforecast


Back to homepage

Leave a comment

Leave a comment