• 315 days Will The ECB Continue To Hike Rates?
  • 315 days Forbes: Aramco Remains Largest Company In The Middle East
  • 317 days Caltech Scientists Succesfully Beam Back Solar Power From Space
  • 717 days Could Crypto Overtake Traditional Investment?
  • 721 days Americans Still Quitting Jobs At Record Pace
  • 723 days FinTech Startups Tapping VC Money for ‘Immigrant Banking’
  • 726 days Is The Dollar Too Strong?
  • 727 days Big Tech Disappoints Investors on Earnings Calls
  • 728 days Fear And Celebration On Twitter as Musk Takes The Reins
  • 729 days China Is Quietly Trying To Distance Itself From Russia
  • 730 days Tech and Internet Giants’ Earnings In Focus After Netflix’s Stinker
  • 734 days Crypto Investors Won Big In 2021
  • 734 days The ‘Metaverse’ Economy Could be Worth $13 Trillion By 2030
  • 735 days Food Prices Are Skyrocketing As Putin’s War Persists
  • 737 days Pentagon Resignations Illustrate Our ‘Commercial’ Defense Dilemma
  • 737 days US Banks Shrug off Nearly $15 Billion In Russian Write-Offs
  • 741 days Cannabis Stocks in Holding Pattern Despite Positive Momentum
  • 741 days Is Musk A Bastion Of Free Speech Or Will His Absolutist Stance Backfire?
  • 742 days Two ETFs That Could Hedge Against Extreme Market Volatility
  • 744 days Are NFTs About To Take Over Gaming?
Zombie Foreclosures On The Rise In The U.S.

Zombie Foreclosures On The Rise In The U.S.

During the quarter there were…

Is The Bull Market On Its Last Legs?

Is The Bull Market On Its Last Legs?

This aging bull market may…

Billionaires Are Pushing Art To New Limits

Billionaires Are Pushing Art To New Limits

Welcome to Art Basel: The…

  1. Home
  2. Markets
  3. Other

GDX and Rates, Time for a Reversal?

On November 10th, after the election news had started to move markets, I was looking for a pullback in GDX (Gold And Miners - Big Election Day Moves, Then Reversals), a pullback to gap support. As we begin December, GDX is looking to have, so far, found support at the gap fill:

VanEck Vectors Gold Miners ETF Daily Chart
Larger Image

There are several things I like on this daily chart (all charts courtesy of Stockcharts.com). There is an RSI(5) divergence forming, declining volume, and potentially a MACD buy cross. My take on this chart is that it’s a good place to look at getting long GDX with a reasonable stop-loss just below the gap support. In other words, breaking lower means I don’t want to be long and would exit quickly.

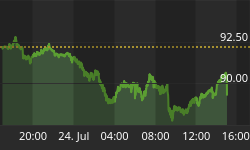
There are couple of other charts that look supportive to GDX here. First, the TNX (10-year yield) chart is almost a mirror image of GDX. As you can see on this daily chart, there is an RSI(5) divergence and a potential MACD sell cross. A pullback in TNX could see rates fall back to 1.875%, the 50% retracement of the move, which would also fill two large gaps that were left when TNX raced higher.

TNX Daily Chart
Larger Image

The TNX monthly chart shows that price has stopped at a down trend line and just below the 100sma:

TNX Monthly Chart
Larger Image

Finally, I think that gold is sitting a potential support zone. As you can see in this daily chart, gold is trading at the 50% retracement zone, in other words, half way between the December 2015 low and the July 2016 high. When I look at these set ups, I see a good place to have exposure to the mining sector, knowing that a break lower in gold or GDX will stop me out with limited downside risk.


Back to homepage

Leave a comment

Leave a comment