


Goldman Sachs Crashes Tech FANG Stocks!
Last Friday June 9th, 2017, Robert Bouroujerdi, a Goldman Sachs analyst, “warned that the $600 billion outperformance by the 5 biggest tech stocks known as ‘FAAMG’ — Facebook, Amazon, Apple, Microsoft and Alphabet — had contributed about 42 percent of all stock market gains over the last year. Goldman worries that the boom has created an “valuation air-pocket,” similar to the ridiculously high valuations for tech stocks during the Dot-Com boom.”
Goldman Sachs comments “market’s over-reliance on FAAMG for growth and appreciation has created positioning extremes, factor crowding and difficult-to-decipher risk narratives.”
Almost like the Dot-Com bubble, investors are piling into the tech stocks with the belief that these companies will continue to generate billions in revenues and branch out into other enterprises to drive innovation and growth. I talked about this two weeks ago; “The Fourth Industrial Revolution, which will be referred to as: Tech Hypergrowth”

(Click to enlarge)
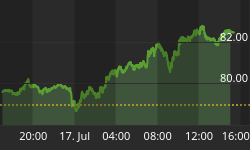
The QQQ’s were trading at $140.15 per share last Friday, June 9th, 2017, but by afternoon, they were down $3.42 (-2.38%). Year-to-date, the QQQ’s have gained 18.29% versus an 8.75% rise in the SPX index during the same period. The heavy losses were focused and contained. It was an orderly coordinated profit taking day!
There was a sector rotation in The Dow Industrials which closed at a new high. Prior to the past year, the last two times that the Dow Jones closed at a high, while the Nasdaq sold off hard, was back in 1999 and 2007.
The Tech sector has been driving the general market yet higher since November of 2016. I keep scanning the horizons in every direction and I just cannot see anything that would trigger more than a minor correction day. Of course, a minor correction could deliver outsized impacts, given the heavy weighting of a few stocks. as well, as passive index investing.

(Click to enlarge)
Are the Financials and The Small Caps Back?
Small Cap stocks, IWM, vaulted all the way up to $139, and it has had a strong follow through on Friday, June 9th, 2017, well above $140. That is a nearly 4% move from trough to peak since Wednesday June 7th, 2017, in a dramatic “V-shaped rally” in Small-Cap stocks.
The DOJI candlestick on the breakout is a sign of INDECISION! I am currently waiting for a re-test of 138.50 before entering this trade. According to decades of studying historical seasonal chart patterns, the month of June almost always closes lower than its’ open. Its’ worst days are June 15th to June 18th. MRM Traders played TNA for the recent run up in price.

(Click to enlarge)
In the SPY, impressive asset flows have hit SPY lately, topping more than $6 billion in this move higher in the past week.
Why Stocks Keep Going Up!
Dr. Ed Yardeni discussed why:
“So far, the current bull market has marched impressively forward despite 56 anxiety attacks, by my count. They were false alarms. I remain bullish. My long-held concern is that the bull market might end with a melt-up that sets the stage for a meltdown. The latest valuation and flow-of-funds data certainly suggest that the melt-up scenario may be imminent, or underway.” Article
In the aftermath of “The Great Financial Crisis of 2017”, Global Central Banks began to buy stocks and bonds and other financial assets in very large quantities and they continue to do so! It is estimated that they will continue to buy $3.6 trillion dollars during 2017. They continue to pump up the global stock markets. This is their response in correcting the forces of past excesses. Their financial engineering may be able to keep this bubble growing bigger and bigger for many years to come. They have reached a point of no return and have no plans to unwind balances sheets.
Will the Financials Lead the Market Higher?
The banking stocks were among the beneficiaries of the tech slump, with BAC, GS and JPM all defying their head and shoulders setups at this time. The XLF, is suggesting further near-term gains for the financial sector while heading into this coming week’s FOMC meetings on June 13th and June 14th, 2017.

(Click to enlarge)
By Chris Vermeulen for Safehaven.com


