Talk about the market busting a move … and a lot of people! In less than half a month, the Trump Rally lost a third of the height it had developed over a period of sixteen months — the worst two-week drop since February 2009. (The market’s moves are so extreme by many measures that the Great Recession is the closest touchstone one can find to assay the last two weeks of market action.)
Most of the plummeting happened in two record-breaking 1,000-point plunges with the total fall taking all indices into the red for 2018. The remaining two-thirds of the Trump Rally remains at peril as the market probes downward to potentially test its 200-day moving average, with the Dow having readily broken through the 50-day and 100-day and now testing its 150-day average:
A break through the 200-day moving average would likely trigger an even larger sell-off as the last major technical support gives way. To give some perspective on the cliff we just leaped off of, look at every move from the cliff-dive into the Great Recession to the present:
Ah, a picture’s worth a thousand words. That’s the plunge so far, but one of the things I said would make the difference between a normal correction of top-heavy prices and an all-out crash would be how much momentum the downdraft developed — enough momentum and the dive will be hard to stop. Well, this just in:

That’s “ever!” Not just worst since we crashed into the Great Recession (which we are still in, as far as I’m concerned, as we have merely existed propped up on life support while all flaws of the Great Recession remained). Clearly, this fall is already equal in steepness and depth to the worst the Great Recession had to offer and greater than any drop since.
And look at that rocket ride in volume (middle set of graphs) from the placid years of the “Recovery” to spikes in volume that rival the Great Recession. The last leg up on the Trump Rally looks like hyperventilating euphoria followed by an hysteria-inducing rush to the exits to me. I think a ride in a catapult that doesn’t let go and just slams you into the ground might be more fun. And the trajectory would look about like those last two up-and-down legs of the graph.
A bigger concern than downward momentum might be the domino effect: A drop one week stabilizes and the market rises a little, but that drop took out one or two companies. The next week we discover some companies associated with those companies that went down also go down, so the market gets scared and falls again … or we find certain points in the market have been reached that trigger larger mandatory actions by institutional funds or other big investors, dropping the market another big jog. The Jinga puzzle starts coming apart block by block, week after week until the whole thing crashes catastrophically.
The permabulls that are still arguing “buy the dip” are hanging by their hoof tips over a pretty big chasm right now. The fundamentals, after all, “have hardly ever been better.” Maybe the Fed just wants to scare them badly before reactivating the plunge protection team. If so, it’s a pretty good scare … like the mafia dangling someone upside down from a window at the top of the Empire State Building. I’m thinking the Fed is believing in its recovery a little too long. Breaking through the 200-day moving average as the final level of known support could be like … well, like this:
Your hot air balloon is descending rapidly due to lack of hot air (Fed fuel ran out). You’ve cast off the last of your ballast, but you’re still going down. Just when you thought that your situation was already dire, you fall through the bottom of the gondola. Oops.
Follow the lemming bulls over their cliff if you want, but it’s a crowded and frantic trade right now. Oh, the roar of the grease paint (with which they write their silly articles) and smell of the crowd.
And this is just the start of the Fed’s Great Unwind. Wait ’till they get serious. Meanwhile, for your viewing pleasure, here are some of the low points along our short journey down so far to gain a further sense of what unwinding means in the world of real events:
Highlighting the low points of an epic plunge
10-year yields hit 2.85%. What the market believes, the market responds to; and the market believes a 10-year yield of 3.0% will result in a sell-off. So, with the yield now at 2.85%, expect the bottom to fall out the market in a panic if interest gets near 3.0% … if for no other reason than the widespread investor belief that it will. In fact, I would anticipate somewhere short of 3.0% people will try to get out before the final panic they believe is coming. With only 0.15% to work within, it won’t take much for the bottom of the market balloon to give way.
Junk bonds had their worst week in two years, with funds losing 1.5% last week. A sell-off in corporate bonds is gaining momentum. Speculative-grade corporate bonds are particularly troubling the oil industry, as rates have risen most in that sector due to the simultaneous drop in oil prices. For example, EP Energy Corp., a producer of natural gas, hit distressed levels where yields on notes due in 2025 climbed to a premium of 11.8 percentage points above US treasuries. In this way, as one reader (David Reutter) here pointed out, the bond-stock collapse is starting to spread from being a strictly financial problem to causing trouble in the broader economy by making business development and expansion harder.
Oil prices finally sledge-hammered back down into the fifties. It was oil’s worst weekly collapse in two years.
Fear factor made worse because diversification is elusive. Gold and bond funds are falling at the same time stocks are. There is no clear path to cover. Of course, this is what I’ve said the mother of all crashes will look like. Everything experiences trouble when the bottom blows out of the everything bubble, which I’ve described in the past as more of a hot-air balloon for size than a mere bubble. This developing crisis started first in bonds, but contagion carried immediately to stocks. For whatever reason, gold is declining in value at the same time. (That’s probably due to the casting off of ballast by central banks that I’ve talked about many times in the past. Central banks don’t hoard gold because they love it. They store it up strategically so that, when they start reducing the heat in their balloon, they can cast off enough gold to protect their own currency from falling. That is why I’ve warned against trusting too much in gold as a safe haven from the big crash that is coming, though ultimately gold has always recovered its value in the past, just as land has.)
Corporate stock buy-backs do not appear to be kicking in to save the day. They are less likely to in this kind of decline because it is one thing to jump in and bail out your own sliding stock values when the market is holding. It is quite another to do so when all sectors of the market are sliding. Believing buybacks will save your own stock in the present situation means you have to trust that numerous corporations are going to decide to do the same thing with their Trump tax savings and that they won’t be fearing as you are that no on else is going to.)
Moody’s this week indicated a lowered credit outlook for the US government could be forthcoming. The US government received its first credit downgrade in history from Standard & Poors in 2011, which resulted in a large market plunge that was only stemmed by the Fed’s quick announcement that it would be rushing in with quantitative easing.) Reason given is that the multi-faceted Trump-Republican lower-tax-and-spend-high programs mean …
The stable credit profile of the United States (Aaa stable) is likely to face downward pressure in the long-term, due to meaningful fiscal deterioration amid increasing levels of national debt.
That’s a shot over the bow for this crazy congress and the triumphant Trump administration: “fix this or we’ll downgrade;” or it’s a CYA where, in case things fall apart, Moody’s can say, “We were starting to warn you.” I think Moody’s is a little slow on the uptake.
That grand Swiss bastion of banking prowess known as Credit Suisse gave notice that it is closing out its XIV volatility trading fund, by which I refer to their speculative gambling apparatus. It is anticipated CS will essentially liquidate the fund at four cents on the dollar on February 21st — in terms of where it has gone from its high just a few days ago to where it is right now. That’s a best-case scenario as to how much those who are involved will get back out. More than a dozen other votalitility-trading funds, including three run by Fidelity, have been shut down by their managers as their values fell close to zero.
While we’re on the subject of volatility: The Dow travelled a total of 22,000 points up and down over the past five market days. I’m guessing that’s the longest road to market travelled in history. The long-sleeping giant has been awakened.
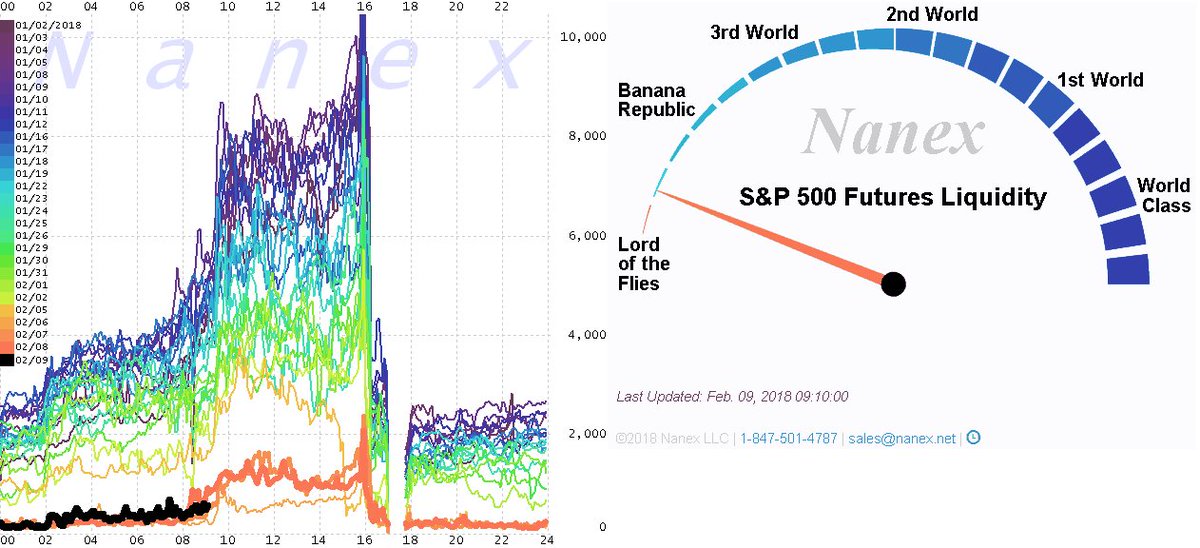
Liquidity in S&P 500 futures flatlined:
Chart shows the average number of contracts available for immediate buy and sell with each colored line representing a twenty-four-hour timeline on a particular date.
As one trader said,
this liquidity flush is the “equivalent of 1987 crash when equity market makers stopped answering their phones.
Risk-Parity funds, which seek to optimize the balance of risks in a stock portfolio in order to be more resistant to market downturns than the traditional portfolios, saw some of their largest losses in history. While risk-parity troubles have been mitigated in the past by equity inflows, February has seen the largest weekly equity outflows in history ($30.6 billion moved out of stocks v. $4 billion inflows to bonds). Nothing to worry about here, so buy the dip. Think how happy you’d be if you had followed that frequently given advice a week ago. Then think of how much of that same happiness you could buy if you follow that same advice this week. Not!
Globally, five-trillion dollars have been lost in stock value since the start of February. Given the knock-on effect that such huge losses can have, a much deeper crash could easily lie a surprisingly short distance ahead.
Well, that was fun.
My advice: stay out from under high windows because markets might not be the only thing coming down. You don’t want to wind up under your stock broker, commodities broker, hedge-fund manager, or bond-fund manager. Could be pretty big piles under the high windows.


