Despite a tough week for stocks into Friday, February 9, three big picture macro indicators have continued to support a risk ‘on’ backdrop. Many of the shorter-term indicators we watch, like Junk bond ratios and the Palladium/Gold ratio say the same thing. Junk/Treasury and Junk/Investment Grade are threatening new highs and as we have noted in NFTRH updates all through the recent market volatility, Palladium (cyclical) got hammered vs. Gold (counter-cyclical), but only to test its major uptrend. Now the ratio is bouncing with the market relief that is so predictably taking hold (here’s a public post where we effectively called bullish, in-day on that Friday).
As for the bigger macro indicators, the middle one, Amigo #2 (long-term interest rates) has that funny look on his face because he is bracing for something.
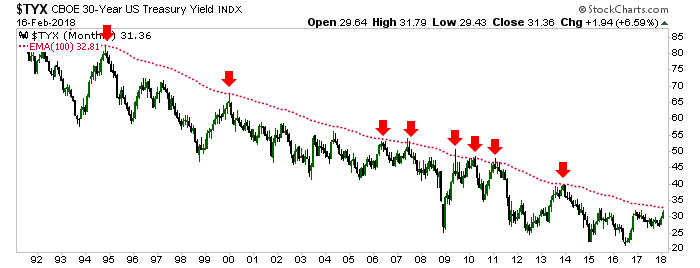
He is bracing himself for impact because he has already smashed into the 10yr yield target of 2.9% (it’s important for people making claims to be able to prove it, and so here again is the December 4th post making the 2.9% claim) and sees the limiter (red dashed monthly EMA 100) on the 30yr just ahead. He knows what happened every other time the yield approached the limiter over the last few decades. Smash! Meanwhile, the hype about the new bond bear market lives on.
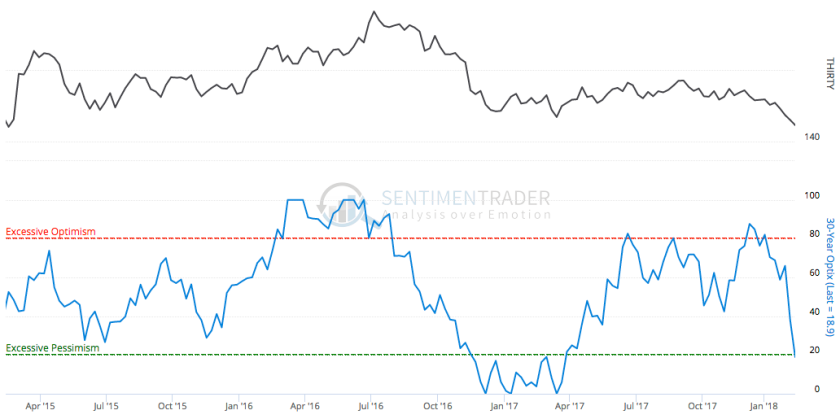
Amigo #2 is probably going to encounter some resistance here because as noted in a previous post, the sentiment backdrop favors bonds right now. Against a range of portfolio long stock positions I’ve done some balancing not only with a few strategic short positions but yes, 3-7 year and 7-10 year Treasury bonds… the same bonds that are supposedly in a new bear market. If people liked them at the previous very low interest rates, they should love them now. But alas, that is not the way markets work.
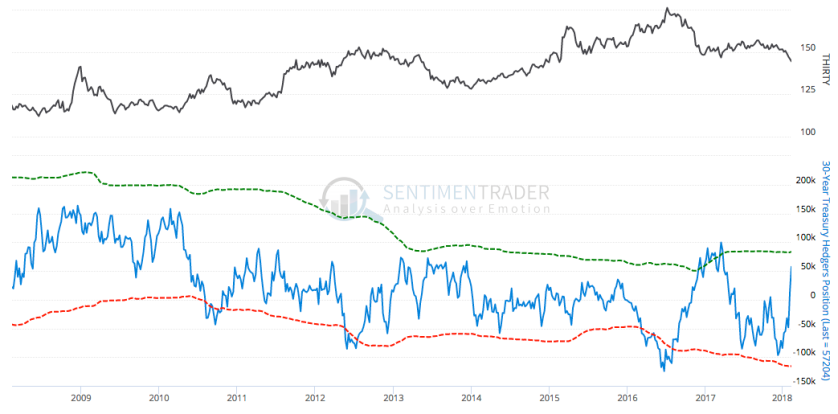
On Feb. 12 we noted that the risk in the Treasury Bond market is in not having any Treasury Bonds and since presenting the sentiment and Commercial hedging data supporting a contrarian bullish view on the 10yr, the 30yr has improved as well to a contrary bullish stance. Here are the latest readings, courtesy of Sentimentrader.
The public has really taken the ‘inflation trade’ that we’ve been working on since December, to heart.
And Commercial hedgers have actually moved to a net long stance, taking other other side (the smart money side) of the trade.
This is not a comment on whether or not a new bond bear is being birthed. It is just a comment about letting it be proven first and meanwhile, keeping said cart behind said horse. Okeedoke? The 30yr bond can decline further and the yield rise further in the short-term, but that Amigo is in essence, played out. So he braces for impact.
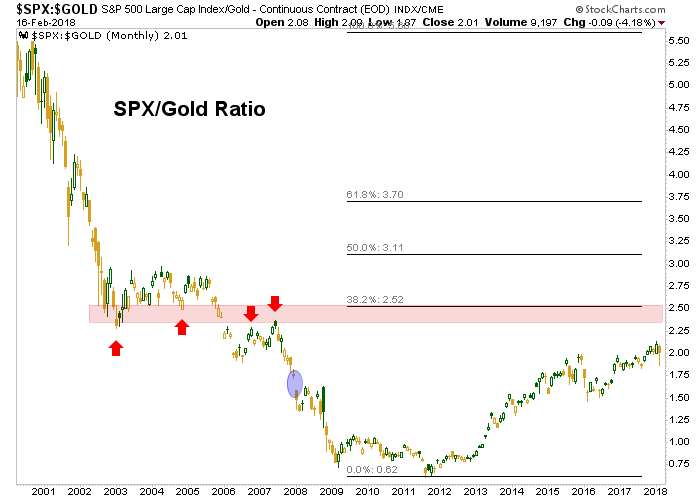
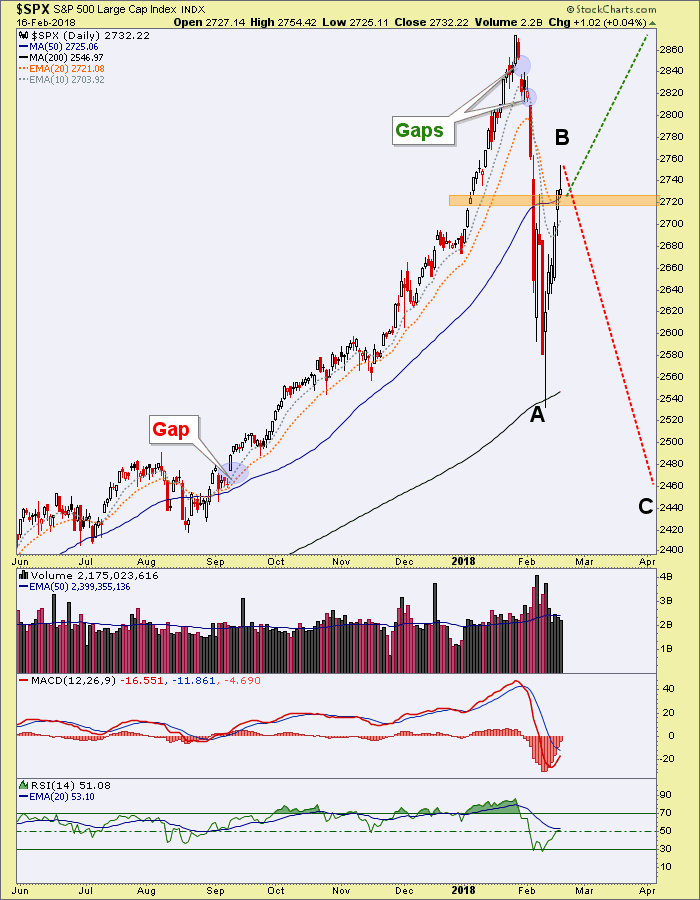
Moving on, Amigo #1 is completely intact. Period. The stock market maintains its uptrend vs. gold and it is no more complicated than that. While we are scouting some sensitive, preliminary and possibly negative economic cycle signals in NFTRH, the duller aspects of the macro are just fine after the recent volatility eruption in US and global stock markets. As such, the trend toward the 2.50 target is intact until such time as this ratio drops below the 2015-2016 lows. This bullish scenario for stocks and risk ‘on’ includes the possibility for a new drop to fulfill a would-be A-B-C correction in stocks to the equivalent of the 2400s on nominal SPX.
If the recent market mini crash was not the final buying opportunity, SPX 2400s could well be. If it comes about and short and long-term macro indicators are intact, that is.
We will of course watch for divergences and/or degradation in the macro backdrop because there is this thing from distant history called a bear market, and it could happen again. But given what the average mope was searching for a week ago per this post, sentiment was fully set up for the rebound in play currently.
Now the market is at its bounce parameters. It will either take them out or fail, perhaps into a ‘C’ leg down. But the big trends are up in nominal SPX and in its ratio to gold (again, cyclical vs. counter-cyclical).
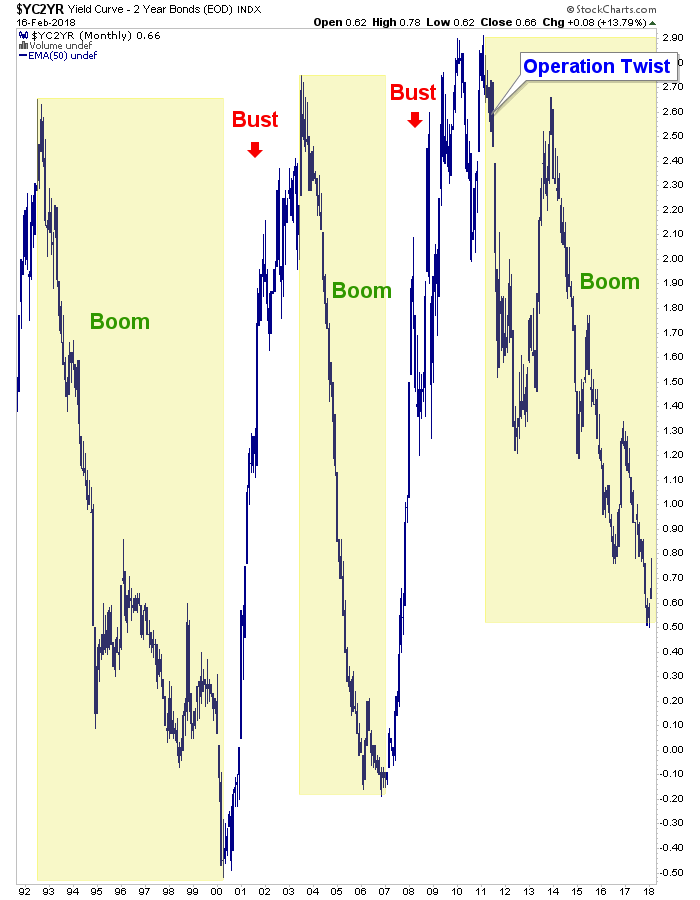
Finally, the forgotten one, Amigo #3. With the predictable uproar about nominal bond yields, the yield curve seems to have gone back burner as a concern. It steepened with the broad market’s recent stress but much like SPX/Gold, it remains on trend… in this case, toward flattening. A steeping curve comes with pressure on the financial and economic system. A flattening curve goes with risk ‘on’ and the happy stuff, AKA a boom.
Most recently, the curve has steepened with a little whiff of inflation in the air, completely as expected, given our projections for rising long-term yields (to targets).
Thus concludes another update of our happy-go-lucky macro men on horses. While long-term interest rates are approaching a logical limit point (whether temporary or otherwise), they are not actionable in real time as a negative indicator. How often have we seen the stock market simply spin a new reason to be bullish? We’ve anticipated a stock market rise with yields under an inflationary regime, but a pause or gentle decline in yields would work well with a temporary return of the Goldilocks spin.
Bottom Line
The macro is intact to a risk ‘on’ situation, even if some of the dynamics may soon change beneath the surface. That view may very well encompass an A-B-C correction to the nominal SPX per this chart’s negative speculation. As the SPX finished the week a hair above our preferred bounce resistance, it also opens the prospect of a try at the two upper gaps or even bull market continuation, with the recent scare having been all there would be as a bullish sentiment cleaner. Next week should be telling, but as for the Amigos, they are still riding and so the macro is still fully intact until they hit targets or abort.
By Gary Tanashian


