


The U.S. market has been on one of the longest bull runs in stocks history. The 9-year old Dow bull has already quadrupled, setting a record as the biggest and longest bull market for the Dow post-WWII.
The corresponding run by the S&P 500 is the benchmark's second-longest bull market ever, with only the 1990s stock market lasting longer (typical market rallies last 3-4 years).
Lately, however, the tide seems to have turned. The S&P 500 and the Dow Jones have gone practically nowhere in the year-to-date, and most sectors are in the red. That seems to suggest that the bull has run its course and is out of steam.
But a few sectors in the market are already flashing double-digit returns, suggesting it would be wrong to assume that the entire U.S. market is overvalued.
Still, analysts can’t help asking whether the U.S. market in general wasn’t already overvalued in the first place.
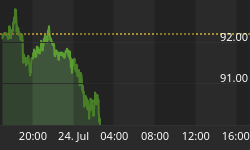
S&P 500 vs. Dow Jones Year-to-Date Change

(Click to enlarge)
Source: CNN Money
Valuing the Markets
Market valuation is a rather tricky affair because there are several ways to look at. It's not uncommon for one model to suggest the market is overvalued and for another to completely contradict that.
Basically, whether the market is overvalued, then, depends on which chart you choose to examine—and psychology. Predictably, many people with a bearish outlook will gravitate toward charts that support their belief that the market is overvalued, while many of those who refuse to give up on the 9-year bull run, will favor the charts that suggest the opposite.
That said, one of the most popular market valuation metrics for years has been the CAPE ratio, or the “cyclically adjusted price/earnings multiple. Related: Trump Backs Oil Over Agriculture
The CAPE ratio has historically been very successful at signaling when the U.S. market was cheap or expensive. Although CAPE is not very useful for identifying market peaks or troughs, it has performed reliably when predicting market returns 10 years out: The lower the current reading, the higher the returns 10 years into the future.

(Click to enlarge)
Source: GuruFocus
The current CAPE reading of 31.6 for the U.S. stock market is high--actually very high considering that its nearly double the mean of 16.8.
You can chalk that up to high PE (Price-to-Earnings) ratios in the market--the current regular PE reading of 25 is way higher than the mean of 16. In fact according to Guru Focus, the current CAPE reading implies a future annual return of -2.6 percent—a very bad sign, indeed.
But what has worked in the past is not always guaranteed to work in the future.
In a recent paper titled CAPE Fear, Research Affiliates demonstrates that the fair CAPE value increases with time and is not a flat line as the historical average would suggest.
Indeed, using the CAPE model would suggest that the U.S. market has been overvalued over the past 30 or so odd years, though in reality we know there have been several secular bull runs in that period.
Other popular market valuation methods include the Fed model and the Graham model. But as we have seen with CAPE, these models have their limitations and using them in isolation can result a lopsided view of the market.
Perhaps the closest thing we have to a weighted model is Morningstar's stylebox--a 10-factor model that captures various valuation metrics.
Related: Bullish Developments Fail To Prop Up Gold Prices
Interestingly, the market’s current Price-to-Fair Value reading of 0.97 according to Morningstar suggests it's trading below its fair value estimate (i.e. undervalued as at 4th April, 2018). A ratio above 1.00 indicates overvaluation; below 1.00 indicates undervaluation, while a reading of 1.00 indicates fair valuation.

(Click to enlarge)
Source: Morningstar
Of the 11 sectors tracked by Morningstar, only Basic Materials, Utilities and Industrials are trading above their fair value estimates, while the rest are undervalued.
Below are 11 sectors and their respective Morningstar Price-to-Fair Value ratios:
• Consumer Cyclical--0.92
• Basic Materials--1.11
• Financial Services--0.94
• Real Estate--0.93
• Consumer Defensive--0.92
• Healthcare--0.96
• Utilities--1.06
• Communication Services--0.90
• Energy--0.96
• Industrials--1.01
• Technology--0.98
As of the time of writing, a few sub-sectors in diverse industries have comfortably outperformed their sectors and the broad market, including technology, healthcare, and U.S.-listed China-based firms.
So, is the U.S. market overvalued?
Maybe. Maybe not. But it certainly looks overvalued if you compare it to other markets around the world:

(Click to enlarge)
By Charles Benavidez for Safehaven.com
More Top Reads From Safehaven.com:


