

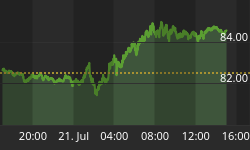


Many looked at recent rise in Treasury yields - and thus slump in Treasury prices - as evidence points to a stronger U.S. economy. The line chart that plots only the closing prices (Chart 1) shows that as of Friday the bellwether 10-year Treasury yield closed higher than two of the prior peaks in March and November of 2005. On a longer term chart (not shown here), this was the highest closing level since June 2004. The S&P, coincidentally, went through a 7% correction from June 2004 to August 2004. In any case, the current uptrend appears to be quite likely to continue. The 12-day ROC (Rate of Change) has been in an uptrend with successive higher lows and higher highs since late November, and it's currently moving into the positive territory above the purple zero line.
So, it's a fact that bond yields are in a strong uptrend, but the rising yields may not have much to do with the strength of our economy. It probably has more to do with the Competitive Tightening, as opposed to competitive devaluing, of monetary policy by major central banks around the globe. Since I may be the first one to coin this phrase, allow me to show you why.

Chart 1
As I've mentioned in the past, the strength of our economy lies in the existing homes market. This existing housing market has been the funding source for the biggest component of our economy, the consumer spending. While it may be fun reading up on these spin doctors' takes on our endless prosperity, it's unnecessary to do so. And, it's equally unnecessary to put too much emphasis on the new home sales. Although new home constructions and new home builders have been frequently analyzed by Wall Street, the volume of new home sales is less than 20% of the existing home sales. Wall Street's propensity to ignore existing home sales has to do with the fact that there's only one publicly traded real estate brokerage firm engages purely in the sales of existing homes. And this firm had just gone IPO 15 months ago.
The slowdown of the existing home sales is quite self-evident on the STIR (Sale-To-Inventory Ratio) chart below. The latest available data shows this ratio dipped another notch from 1.37 in December to 1.25 in January, an 8.76% decline. This ratio has dropped 44% since the high of 2.22 in January 2005. At this rate, the STIR could fall below 1 in about 6 months. And, that's when the real trouble begins. While a declining STIR indicates that sales activities have been outpaced by inventory buildup, a STIR below 1 means serious dissipation of demand.
We're essentially reducing all the smoke and mirrors and all the complicated econ models to just one relevant aspect of our economy - consumer spending. We further reduce that to just one simple chart, the STIR chart of the sales of existing homes, which is also known as the ATM machine. And the STIR chart disagrees with the general assessment of a strong economy.

Chart 2
A correction in existing housing market leads to diminishing demand for goods and services, which in turn diminishes corporate profit margins. This diminishing demand is best demonstrated by the eminent decline in M1 money stock supply, the most liquid form of money, or essentially cash in hands of public.
Chart 3 is a 52-week (1 year) M1 money stock supply Rate of Change (ROC) chart. Past recessions of 1989-1990, 1995-1997, 2000-2001, and briefly of 2002 coincided with the ROC's decline into the negative territory. Recently, for the week ended 2/20/2006, M1 again fell into the negative territory, to minus 0.21%. Realistically, I wouldn't be at all surprised if we're already in the beginning of a recession.
Incidentally, I've mentioned in the past that no analysts, and I mean no one, had noticed the surges of M1 in 2000, right after the Y2K, and then in 2003 were more likely than not the result of the refi and real estate boom. It's those huge deposits of 100's of 1,000's of dollars of sales and refi proceeds that first went through the banking system that accounted for these huge increases. Without those 2 peaks, the current M1 ROC might've ended up way below the minus 5%-6% trough set in 1996. This, by all means, is yet another manifestation of the existing housing market's significant impact on our economy.

Chart 3
But the decline in M1 rate of change is only the trouble in the short-term. Unfortunately, the diminishing demand caused by the long-term income inequality is going to further exacerbate our economy for generations to come. Chart 4 shows that, from 1967 to 2001, only the households in the highest income quintile (top 20%) enjoyed an increase in their share of the aggregate income - where the burgundy bar grew higher than the gray bar. The rest of the 80% households actually lost their shares of the aggregate income with the middle class (3rd quintile) taking the biggest hit. The top 5% on the far right of the chart gained the biggest share of the overall income during that span of 35 years. This 5% of the households represents the share of almost a quarter of our collective income. 2001 data were the most recent statistics available. However, it should be safe to assume that the inequality in recent years could only become worse.

Chart 4
Students of Econ 101 know that great inequality would not generate sufficient aggregate demand. And, there are political and economic costs associated with this disparity when, according to John Maynard Keynes, "a capitalist society rejects a more equal distribution of incomes and the forces of banking and finance succeed in maintaining the rate of interest". One such cost of the recent rate hike cycle in the U.S. is the diminishing American consumer demand, particularly the consumption of the middle class households. And, when American consumers buying of foreign imports slows down, the foreign buying of the U.S. Treasuries slows down.
In addition, income disparities are often caused by unregulated capitalism or capital flow. It's the flow of capital that ultimately allows a monetary system to function. On the international level, if a country's macroeconomic policies depart from the average policies of the other countries', there will be movements of capital. With the Fed setting the U.S. interest rates apart from the rest of the world, the movement of capital has been flowing into this country. This has given the Dollar quite a boost. But, knowingly or not, this recent U.S. led credit tightening cycle has started a ripple effect of a competitive tightening monetary policy around the world. And, this global competitive deflationary champagne may require the Fed fund's rate to go up to 6% just to stay barely competitive.
Please stay tune for Part II of Competitive Tightening...


