


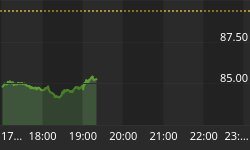


Please consider the following chart.
Mish note: I can not read what the text says but if you can please send me a translation. Regardless of what the text says, however, the universal language of the chart makes it quite clear that whatever is happening is not pretty.

Enquiring minds may be interested to discover that the above chart happens to be a graph of the Saudi stock market.
The Financial Times is reporting the Saudi market plunges 8% more.
The Saudi stock market plunged another 8 per cent on Tuesday, taking its fall over the past nine days to 26 per cent. The Tadawul All Share index was trading at 12,994 late Tuesday, compared with 17,557 at the close of trading on April 9. It has fallen 37 per cent from its February peak to its lowest level for eight months.
Analysts said it was a dramatic reversal after the oil-fuelled boom that led to spectacular share price gains in 2004 and 2005 and saw up to 3m retail investors piling into the market in search of quick wealth.
Oliver Bell, senior investment manager at Pictet Asset Management in London, said the market still appeared to be over-valued.
"We estimate the Saudi market is trading on a forward multiple of nearly 30 times 2006 earnings. Despite the correction, valuations are still at extreme levels compared to other emerging market opportunities," he said.
Reuters is reporting Saudis go online to vent anger over stock crash.
Normally submissive Saudis turned to the Internet on Tuesday to voice their anger about slumping share prices. A 37 percent tumble in the Arab world's largest bourse since late February has transformed the Web from a popular source of trading tips to a forum for small-time investors to vent their spleen.
"The market has become a burial ground for Muslim money and slaughtered ambition," said an Internet user on one site, who identified himself as "the Living Conscience".
The Saudi market began to tumble in February when the regulator tried to narrow the trading bands allowed each day, angering speculators.
The regulator's decision to suspend dealers for market manipulation earlier this month only exacerbated the slide and shares plunged more than 8 percent to new eight-month lows on Tuesday.
"The index has been bleeding for more than 45 days. All we can do is watch and shed tears, tears and more tears," said Mohammed9009.
Perhaps the most interesting thing in the above report was that attempts to stop the slide by narrowing trading bands suspending those accused of market manipulation seemed to exacerbate the slide.
An Active Role
Interestingly enough, Reuters recently reported Central banks should be active in a crisis.
Financial markets suffer destructive gridlock in a crisis as investors bolt for safer investments, but central bank intervention can keep the system up and running, according to a study presented at the Atlanta Federal Reserve on Monday.
The paper, written by economists Ricardo Caballero and Arvind Krishnamurthy, studied a flight to quality as market players protected themselves from worst-case assessments of the risks, even though the danger in their own market was small.
It was delivered at a conference on financial markets and systemic risk chaired by Fed Vice Chairman Roger Ferguson.
"Agents respond to uncertainty regarding other markets by requiring financial intermediaries to lock up some capital to devote to their own market's shocks, regardless of what happens in other markets," the paper said.
"While each Knightian agent covers himself against an extreme shock, collectively these actions prevent intermediaries from moving capital across markets to expediently offset shocks as they arrive," the authors said.
Knightian uncertainty -- based on the work of Chicago University economist Frank Knight -- is a theory in economics describing risks that are impossible to measure, which is why market participants overreact in seeking capital protection.
"This inflexibility leaves the economy overexposed to (moderate) aggregate shocks that are manageable by the private sector in the absence of flight to quality," they said.
With that paragraph, the Mish telepathic thought lines were flooded with questions.
The typical question was something like this: "OK Mish what does any of the above have to do with 'Canaries at the Periphery'?"
Canaries
The answer of course is that problems start at the periphery then work their way towards the nucleus. That is simply the nature of the beast. Please consider Canaries in the Coal Mine.

Against a backdrop of strong global growth, two small Western economies have hit upon hard times: Iceland and New Zealand. Their experiences, in the context of their geography and financial characteristics, could be heralding the onset of a fresh global financial crisis.
But regardless of whether the Kiwi/Icelandic break was due to speculation or spending, there are certainly some broad financial discrepancies that are showing at least some signs of rectifying themselves. And as the Asians discovered in 1997-1998, such "rectifications" are rarely pleasant processes.
The Hindenburg Omen
Closer to home John Hussman is writing about Market Action and Information.
In a richly valued market with upward interest rate pressures, it's a particularly unfavorable sign when within just a few days of new highs in the major indices, leadership "flips" so that the number of individual stocks achieving new 52-week lows actually exceeds the number achieving new 52-week highs. That's exactly what happened last week. The S&P 500 achieved a fresh bull market high on April 5th, at 1311.56, yet new lows have already flipped above new highs.
Hindenburgs
I've noted often that a great deal of the information conveyed by markets is contained in "divergences" between securities. While investors shouldn't read too much into any indicator, there's an interesting signal that has enough validity as a measure of divergence that it's worth mentioning here. Think of it as slightly more than entertainment value but far less than a reliable guide to investment.
The signal is based on new highs and new lows, and is cheerfully called a Hindenburg (the actual name given to it by Kennedy Gammage is the "Hindenburg Omen" but that strikes me as far too, well, ominous, because it's certainly not a sufficient condition for a market decline). It's a relatively unusual event that has often preceded fairly substantial market declines with a fairly short lead time (usually within 30-60 days, including declines in 1987, 1990, 1998, 2000 and 2001), but has sometimes proved to be meaningless or insignificant as well (such as a cluster of signals in September 2005, among others).
The basic elements are 1) the market is in a rising trend, defined as the NYSE Composite being above its 10-week average, 2) both daily new highs and new lows exceed 2.2% of issues traded, and 3) the McClellan Oscillator is negative - meaning that market breadth as measured by advances and declines is relatively weak (there's some dispute, which I will not join, as to whether the Oscillator has to be negative that day or turn negative later). Peter Eliades added a couple of other conditions to eliminate signals occurring in clearly strong markets: 4) new highs can't exceed new lows by more than 2-to-1, and 5) 2 or more signals occur within about a month (he uses 36 days) of each other.
As it happens, we observed a Hindenburg on April 7th (just 2 days after the market high) and another one on April 10, so those elements seem to be in place here. We'll see whether anything comes of it this time around.
When a well respected fund manager like Hussman is watching Hindenburgs and other technical divergences, perhaps you should too. I do know that Brian and I are carefully watching those divergences at the Survival Report.
Our view is that the longer this grind up occurs in the face of rising interest rates, deteriorating fundamentals, and huge divergences, the deeper the resultant plunge. Rot is now chewing its way at the periphery. It's only a matter of time before rot works its way to the core.


