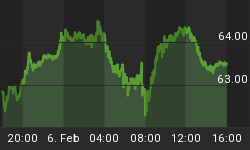
Dow Jones Industrial Average 11,019
Value Line Arithmetic Index 1,943
30-Year Treasury Yield (TYX) 5.23%
20+ Year Treasury Bond Price (TLT) 83.59
Gold 1/10 Ounce (GLD) $57.74
The Big Picture for Stocks
The 4-year cycle calls for a bear market bottom in late 2006.
Technical Trendicator (1-4 month trend):
Stock Prices Down
Bond Prices Down (See below)
Gold Price Up
Bonds
Our Technical Trendicator Model for bonds has fizzled out, giving a new sell signal. We will take a small loss versus the May 18 buy signal at 84.21 on TLT. Overall, the model is well ahead of a buy-and-hold strategy. Since inception of the model in 2003, our cumulative return on our trading strategy has been a positive 35.5%. A buy-and-hold strategy would have produced a negative 2.4% return. The sell price will be posted as of the opening June 23.
Market Cycle History Revisited
In the archives section for subscribers on our website, there is a spreadsheet table of market cycles going back to the year 1900 You can gain a number of insights by studying this table. One interesting statistic is that the average bull market lasted 29 months. If we assume the current bull market ended in May 2006, it lasted 41 months from its beginning in October 2002. So this bull market was 11 months older than the average. While not as robust in terms of price as many, if May was not the top, we are living on borrowed time. Most likely, May was the top for this cycle.
Scarier is that the average bear market has taken the Dow Jones Industrial Average down 30%. If this bear market is only average, it will decline to about 8200 on the Dow.
Special Situations
The little stock we put on our buy list the other day -- PainCare Holdings (PRZ) -- had great news this week. They reported first-quarter earnings of 17 cents per share, compared to a loss last year after accounting changes. Revenue for the quarter was $23.3 million, a 64% improvement over the same quarter last year. The stock has jumped to $2.04 from our initial buy at $1.20 on June 7. Based on this report, the stock still appears cheap versus earnings. It appears likely that they will be raising guidance, which previously was 20-22 cents per share for the full year. We have posted a trading target sell price on our site.
It is feast or famine lately for our microcap stocks, with many of these stocks down significantly. But it only takes a few really good ones to keep our overall results high. So far, we seem to be able to hit a good one often enough to maintain an average annualized rate-of-return on all closed Special Situations stocks (those liquidated from the list) in excess of 100%.


