


Article originally submitted to subscribers on 22nd November 2006...
What in the World is going on?
The Stock Market is moving higher against all projections,
The Bond Market is showing no immediate signs of inflation,
The Dollar just refuses to break down and Gold as a result cannot move ahead with any conviction,
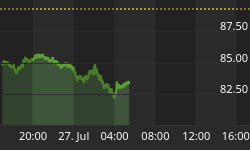
Oil is hitting new lows and Copper has begun to break down.
And last but not least, there is almost no risk premium in the market as the VIX has broken to new lows.
What are we to make of all this?
Is it a sign of a healthy or unhealthy market?
I guess that depends where you are invested!
When the picture gets cloudy I find it best to take a step back and focus on the Big Picture.

Chart 1- Dow : Gold ratio
The Big Picture tells me that Stocks are still mired in a secular Bear Market.
That is, the Real Value of Stocks as measured against real wealth - Gold - have been declining steadily since 2000.
Towards the middle of 2001, the Dow:Gold Ratio broke below a descending triangle formation (pink lines). The forecasted target was 25. The ultimate low for that down leg occurred at the beginning of 2003 at 19 (Dow 7,416 and Gold $389)
Of interest is how the initial break out of the triangle formation was totally recouped towards late 2001. In other words, the breakdown was retested in classic technical action.
Contrast this with the current picture:
At the beginning of 2006 the Dow:Gold ratio entered a new down leg when the price broke below the right angle triangle (blue). The forecasted target is now 10 on the ratio.
Since mid-2006 the ratio has all but recouped it's initial down leg to retest the breakdown in much the same fashion as 2001.
How will it all go down?
If the Dow : Gold ratio ends this leg at a value of 10, what would be the price of the Dow and Gold ?
Assuming the timing is similar to the first down leg, the Dow : Gold ratio would reach a low of 10 by late 2007.
That probably gives Gold enough time for one more up leg:

Chart 2 - The last up leg in Gold went from $410 to $730
Based on my calculations (using a personally adapted method of Fibonacci projections) I have a target of $1,000 for Gold by late 2007.
Calculations: The last up leg went from $410 to $730, a 78% move.
Multiply 78% by 0.618 and add 1 equals 1.48.
Extend the previous peak by multiplying $730 by 1.48 = $1,080 (rounded to $1,000).
At a Dow : Gold ratio of 10 that would put the Dow at 10,000. Hardly a Crash but the result of Massive Monetary Inflation.
Intermarket Picture
The market is being Juiced Up on so much liquidity that no paper assets are being allowed to correct.
Gold is also outperforming other real Assets such as Energy and Industrial Metals. The last time that happened was in 2000 before the last Bear market in stocks. This is early confirmation that growth is slowing and a shift to less risky assets is underway. The Fed's response will be predictable - more money printing!
I am beginning to think the only way the monetary universe will correct is for Gold to move a lot higher against all paper assets and other commodities. As a result, the next 12 months should be very exciting for Gold Stock Investors!
More commentary and stock picks follow for subscribers...


