


Weekly Trader Alert #86
1/9/2007 9:08:06 AM
Welcome to the new look of the Fundamental Trader. We hope you enjoy it and any comments are welcome and should be directed to fundamentaltrader@stockbarometer.com.
Overview
This holiday shortened trading week was cut to only three days by market closures in respect to the late U.S. President Gerald Ford. Those three days saw a significant increase in volatility, however, which made for significant moves in the market.
Wednesday's open reflected pent up optimism and the market roared up, only to sell off in the middle of the day, which accelerated when the Fed release the minutes from their December meeting. Those minutes showed the economy was a bit softer than anticipated, but more importantly, that they were still quite concerned about inflation. This served to reduce chances of any rate reduction in the short term and raised the discussion on the possibility of a rate increase! This sent Bond markets tumbling and the stock market right along with it on Wednesday.
In addition, warm winter weather has caused unusually light demand for oil and natural gas, with increasingly larger than anticipated reserves of all sorts of refined products including gasoline, distillates, and heating oil. This caused an 8.9% reduction in the price of a barrel of oil in two days, which is the largest two-day move in the last couple of years. Friday, saw a bit of a recovery, with oil bounding off the $55 level to close above $56, and natural gas maintaining its price a bit above six dollars.
Friday's jobs report showed greater than expected growth in jobs, but wage growth was also quite a bit higher than expected, coming in at 0.5% growth in December, i.e. an annualized rate of some 6%. That was enough to draw a comment from at least one Fed official, and the constant refrain of worries over inflation is dampening enthusiasm for stocks.
Finally, prior manufacturing reports had been showing a contraction. The December ISM manufacturing index moved back above the key 50 level to 51.4 from 49.5 in November, indicating expansion. The ISM service index fell slightly to 57.1 in December from 58.9 in November. November construction spending dipped a lower than expected 0.2% and November factory orders were up a bit less than expected.
The two most significant drags on the economy have been housing and automobiles. December auto sales were up a bit, which alleviates some downward pressure. In addition, same store sales data from retail chains reflected moderate growth. Wal-Mart posted a gain of 1.6%, while Target came in at 4.1% and Costco a whopping 9.0%.
It seems that the psychology may be changing in the market. Although the soft landing may be occurring, the Fed won't stand by if the inflation bugaboo keeps raising its head, and that could be enough to destroy a soft landing, which has investors concerned.
To understand more about our view on the markets, we will have to look at the charts.
Market Climate
The market finished its last two days of the Santa Claus rally in mixed fashion, with the NASDAQ heading higher, and the NYSE selling off. Friday saw a broad-based retreat across both the NASDAQ and the NYSE and the sentiment seems to be one of concern.
With down volume being greater than up volume for the last weeks, there is some concern now of a correction being imminent.
The U.S. stock market composite chart:

When we look at the chart for the US Composite, we see what appears to be the start of a new move downward. The market actually hit a new intraday high on Wednesday, the second to last day of the Santa Claus rally, and then began to sell off, closing on the 20-day moving average. Thursday's move opened from below the 20-day moving average while trading back up to it. Friday's move lower challenged the 50-day moving average but closed above it. It closed on the lower Bollinger Band. The question traders will be asking themselves is, will the market begin to walk that band downward, or will it bounce back up?
While markets tend to have an overall bullish bias (markets inevitably rise over time), it appears that there is a lot of concern over the extended rally we have seen over the last six months. With greater volume coming on a downward bias, we would wait for a reversal of a leading indicator before we would take a long position. If anything, it is worth considering bearish bets, perhaps on stocks in the retail industry after soft holiday sales.
Fundamental Trends
There are three repeats, both somewhat predictable. The logical entry is the airlines. Having been in a long term bullish trend, and with predictions of industry consolidation (and some evidence of attempts at this) occurring regularly, plus the continual drop in energy price, it was inevitable that this industry would garner interest.
The wildcard is the Telephone Utilities. While we have noted its participation in the top screen, the noted defensive nature of utility stocks means that, once again, investors have an interest in defensively positioning their portfolios.
The four building industries present in the top screen (top 31 industries) a week ago have dropped to a single entry, cement. The business services industries repeat with three entries but petroleum has disappeared from the top screen altogether. Not surprising with oil prices dropping like a rock.
Three retailers entered the top screen, all toward the bottom. We see quite a mix of optimism and pessimism regarding retailers, and analysts are all over the place on them. Retailers will likely have mixed performance.
The meat industry moved into sixth place and is the only food industry in the top screen. Basic Steel has dropped from the top screen, although the steel alloy industry continues there.
There is quite a bit of turmoil underneath the surface as interest in defensive issues rank with interest in some cyclical and growth industries while the opposite also appears to be occurring.
The Industry leaders (ranked 1st-5th out of 190) are:

There really isn't anything new about the laggards, other than the distributors of metal products appearing within their ranks. The others were either there last week or the week prior.
We are still puzzled with the Plastics industry being in the laggards, with oil prices continuing to drop. The biggest raw input into making plastics is petroleum, so with prices falling, we would be looking for a rebound in this industry group. We are going to monitor these companies to bargain hunt, when it appears they have bottomed.
The Industry laggards (ranked 186th-190th out of 190) are:

Trade Recommendations
We have noted a lot of turmoil with both short and long candidates showing up on our screens. We will wait a day, and may recommend a hedged trade, which can take advantage of both up or down moves during the potentially volatile earnings reporting season.
We may issue an alert intraday today, but will likely wait until after the market close to assess the affect of Alcoa's earnings release.
Current Portfolio
We are still in a short trade on the QQQQs. Last Thursday's sharp move upward has not been followed up. In fact Friday's Harami pattern was followed by a doji on Monday, so it appears the the NASDAQ may fail in its upward momentum. This will be influenced by announced financial results this week.
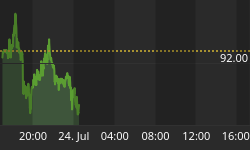
FDG continues to languish at the bottom of its trading range. It is getting no love from investors as the price of oil continues to drop and threatens to break below $55 per barrel. Continue to hold and collect the dividend. With the price below $20, we are collecting a dividend of more than sixteen percent annually.
* Initial stop prices are set to cause us to exit our positions if they close below these levels. You will note they are generally kept pretty tightly the opposite side of the trades we initiate. Historic volatility would imply that intraday price action may trade outside of these values, so that condition is insufficient to cause an exit from an existing position. On significant movement beyond our stop prices, we may issue an intraday message to exit the position or to maintain the position. You may chose to implement an absolute stop below these suggested stop values, but that stop should be wide enough to take care of the daily volatility for the stock in question. You can examine the candlesticks for an idea of intraday price fluctuations.
Entry prices are adjusted to account for dividends paid. The stock price was adjusted by your broker, to reflect the dividend taken out. The non-adjusted entry price reflects the actual entry price, without the adjustment for dividend values.
LVPB Concept: The concept is a Light Volume Pull Back, where a stock's price will pull back to a support level on light volume. Obviously, heavy selling is a sign of weakness, and we would not want to buy on a heavy volume pullback. However, we will occasionally place stocks on the LVPB (Light Volume Pullback List) to indicate a "re-entry" buying opportunity, when we have already entered a position. This should be used to add to existing positions, or to enter a position if you missed the initial entry.
LVPB Portfolio Stocks:
Conclusions
True to form, the markets completed the Santa Claus rally period nominally bullish, with the NASDAQ making a better showing, but even the NYSE did move up to some degree. Thursday marked the last day of the Santa Claus rally and Friday's move ended the week with a bearish tone, with the S&P-500 finishing lower than the gains seen during the Santa Claus rally period.
With all the major indexes having broken their long term uptrend lines, we are looking for another challenge downward. Some indicators are showing oversold levels, so a bounce here is possible.
This coming week is the beginning of earnings season, with the significant start the week of January 15th. Earnings reports generally move the markets so look for more trading action to get under way shortly.
For those of you who have enjoyed your subscriptions to the Fundamental Trader and who would like to get additional savings off the price of your subscription, you may consider an annual subscription to the service. You can save nearly 20% off of the monthly rate by selecting the annual subscription price. Just click on the link below:
http://www.stockbarometer.com/pagesMFT/learnmore.aspx.
Regards and Good Trading,


