


Market Wrap
Week Ending 3/16/07
Economy
The Labor Department reported a 0.4% increase in the consumer price index, which followed on the heels of a 0.2% increase in January. Core prices, excluding food and energy, were up 0.2%, and 2.7% from one year ago. Overall prices are up 2.4% from last year.
Food prices comprise about 20% of the CPI. They increased 0.8%, the most since April 2005, after a 0.7% rise in January.
Energy prices were up 0.9% in February, after losing 1.5% in January. Temperatures were much colder in February then in January, causing more demand for heating oil. Natural gas prices rose 5%. Gasoline prices gained 0.3%.
Housing costs account for one-third of the total consumer price index. Prices rose 0.4% in February after increasing 0.2% in January.
The National Federation of Independent Business reported that 13% more small-business owners reported higher selling prices last month.
Capacity utilization, a measure of the proportion of manufacturing plants in use, rose to a five-month high of 82% from 81.4%.
The Reuters/University of Michigan's preliminary index of sentiment declined to 88.8 in March, down from 91.3 in February.
Wages
The increase in food prices may be starting to affect worker's take-home pay. Hourly earnings adjusted for inflation fell 0.3%, the second such monthly decline.
Real hourly wages are up 1.8% since February 2006. Wages are up 2.2% for the last year ending Jan. 2007.
Inflation is stubbornly holding above the Fed's comfort level, while growth in the economy, especially considering the down turn in housing, and the weak manufacturing sector, is suggesting that stagflation may be developing. Not what the Fed wants.
Inventories/Sales
The U.S. Census Bureau reported that the combined value of distributive trade sales and manufacturer's shipments for January, adjusted for seasonal and trading-day differences, but not for price changes, was estimated at $1,057.8 billion, down 0.7% from December 2006.
Manufacturers's and trade inventories, adjusted for seasonal variations, but not for price changes, were estimated at an end-of-month level of $1,370.2 billion, up 0.2% from December 2006.
The total business inventories/sales ratio based on seasonally adjusted data at the end of January was 1.30. The January 2006 ratio was 1.25.

Subprime Loans
More than 30 subprime lenders have gone bankrupt in the U.S. since late 2006.
Delinquent payments on loans of all types rose to 4.95% from 4.67% during the third quarter of 2006.
Delinquencies will have a slowing effect on the economy, as its repercussions slowly filter through the system. The numbers are considerably worse for subprime borrowers, with 13.33% presently behind on payments.
Defaults could spread to borrowers with Alt-A or jumbo mortgages, a class of mortgages that represents $1.14 trillion in loans, or 12% of the entire mortgage market - according to Bear Stearns.
Subprime loans comprise 15.2%, or $1.45 trillion of total mortgages, and jumbo mortgages are $1.41 trillion, or 14.8%.
The National Association of Realtors reported that the median home price for existing homes was down 8.5% in January, from a peak of $230,000 in July.
The current downturn in home building could lead to a significant decline in employment, as approximately 40% of all jobs created between 2000 and 2005 were tied to the housing market, and housing and related industries account for about 23% of the U.S. economy.

The above chart is of Countrywide Financial Corporation, the now infamous player in the subprime mortgage market. Will there be more downside - yes. Will there be further problems in the subprime loan area - yes.
Lehman Brothers has forecast that "mortgage defaults over the next two years may climb to $225 billion", while the Fed has stated that as many as "1.5 million more Americans may lose their homes".
Stocks
As everyone is well aware, stock markets around the world have had a rough go of it the last couple of weeks. Several reasons are usually given: the subprime loan issue; the unwinding of the yen carry trade; and just plain overall liquidation to meet margin calls.
The stock markets are all asset bubbles that have just been waiting to be popped. If it wasn't the subprime debacle, it would have been some thing else just as sinister, although we hasten to add that there does seem to be poetic justice running afoul.
Now market players are starting to question whether or not the contagion will be contained to the subprime market, or if it will spread to other sectors?
Symptomatic of these fears are the charts of the Financials Select Spyder (XLF), which provides an overall view of the industry; and Bank of America, which gives a more specifically focused example.


As can be seen - the contagion is spreading. Is there more yet to come, or is this all?
There is more yet to come, as after every boom follows the inevitable bust; until such time that Honest Money, as mandated by the Constitution: gold and silver coin, circulates as the currency of choice - free choice, not because of legal tender laws had by forced compliance.
The overall stock market has been feeling the pain as well. Below is a daily chart of the Nasdaq Composite Index, which has had a nasty break below its lower trend line, and is approaching its 200 ma.
There may well be a short term rally; however, more intermediate term downside action is likely.

For the week the Dow lost 1.4%, and the S&P 500 fell 1.1%. The Transports were down 1.0%, while the Utilities gained 0.9%. Brokers dropped 3.1%, and the Banks declined 2.3%.
The amazing thing about the fall was not only how fast it happened, but how complacency was running rampant and the goldilocks economy/market mantra was on everyone's lips.
Below is a chart of the VIX Volatility Index, which shows the future expected volatility of the market. As the chart illustrates, it went from a low of 10 to a high of almost 20 in less then a month's time; and has since fallen and rallied by almost half as much - all within a few week's time.

Stock markets around the world have all been experiencing similar moves. Below is the point and figure chart for the Hong Kong Hang Seng Index that shows a bearish price objective about 5% lower.

Bonds
Two-year government yields fell 8 bps to 4.59%. Five-year yields lost 6 bps to 4.47%. Ten-year yields were down 4 bps to 4.55%. 30-Year bond yields gave up two bps to 4.70%. The spread between the 2 year and the 10 year closed the week inverted 4 bps.
The Fed still has its inverted yield curve, but it's shrinking weekly. Will they be able to hold on or not? We believe any surprises in interest rates will be to the upside, which will only hasten to exacerbate the problems in the already weakening housing market.
Below is the chart of the ratio of the 30 Year Yield compared to the 5 Year Yield. We have also compared it to the performance of gold.

As the chart illustrates - gold moves inversely to the bond ratio. Notice how since April the bond ratio has been moving sideways - as has the price of gold.
Both have been locked in a trading range. Look for the direction that one breaks - to hint at the direction of the other.
Fed foreign holdings of debt increased $11.4 billion last week to a record $1.86 trillion, a 26% annualized increase.
U.S. Dollar
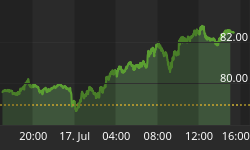
The US dollar index dropped 1.5% to 82.94 for the week. The dollar fell to its lowest level so far this year against the euro, and dropped versus the yen because of yen carry trades unwinding.
As the chart of the dollar below shows, the currency has broken below its lows from Jan. & Feb. Its Dec. 2006 low of 82.35 best hold or there will be trouble in paper fiat land.
Did Sir Alan know when to retire? What a nice present he left for Ben - to clean up, not that he or anyone could, within the presently existing monetary system. A thought: perhaps a different monetary system is needed.

The point and figure chart of the dollar does not engender much hope, as it projects a bearish downside target of 78.00.

Due to the unwinding of yen carry trades; the yen has rallied as of late. The point and figure chart below still shows a bearish price objective of 76, which is over 10% lower from its present price.
This does not mean that such a price objective will or will not be reached. It simply is what the chart is saying right now. Charts like anything - can change overnight. The one thing that remains constant is that nothing remains constant and even that might not.
We have just seen the above play out in the world's stock markets.

Next up is the euro/dollar chart. It shows the euro having just broken out to the upside. The future of the US dollar does not look too bright.

International reserve assets, excluding gold, were up $841 billion to a record $5.04 trillion for the week, a 20% year over year rate of increase.
Oil & Gas
Iran's President Mahmoud Ahmadinejad asked to address the United Nations Security Council, reportedly causing speculators to assume that no reduction in Iranian oil supplies will occur for military or "diplomatic" reasons. Subsequently, crude oil fell to a six week low.
Prices are down 4.9% for the week, and are 10% lower compared to a year ago. Natural Gas fell 2.2% this past week.
Energy Secretary Samuel Bodman stated that the government plans on refilling the strategic oil reserve as early as April. The U.S. Energy Department plans to buy up to 4 million barrels of crude oil to replace 11 million barrels sold from the strategic petroleum reserve in the wake of Hurricane Katrina.
The replenishing rate is targeted to be 50,000 to 100,000 barrels a day. Bodman said at the time that the government would stop buying if its purchases caused prices to rise.
Perhaps I'm reading it wrong, however, how does 4 million barrels replace 11 million barrels? That amount (4 million) is less than half the amount (11 million) released after Katrina?
Below is the daily chart for West Texas Crude, which shows the recent rally to have been, at least so far - a counter-trend rally of the break below its previous rising channel.

Next up is the weekly chart for natural gas futures. The chart shows a fall of greater then 50% since the end of 2005, which was right AFTER Katrina.
Such timing does leave room to allow one to wonder about the precipitating cause of such extraordinary price action. Cui Bono?

Commodities
Overall commodities were down for the week, although some had stellar performances.
Copper prices were up 8.1% for the week, supposedly due to rising demand in China, the world's largest consumer of the metal.

Below is the CCI Commodity Index, which shows a loss for the week, but a definite uptrend from the lower left to the upper right hand corner of the chart in place: a bullish signature indeed.

Gold
For the week gold gained $1.90, closing at $653.90 (+ 0.29%). It closed at the highest daily close of the week, and the highest weekly close in the last 3 weeks. Intra-week it hit a high of $656.50 on Friday.
As the chart below shows, gold had a good break out back in late Jan. to Feb. It rallied to a high of $692.50 towards the end of Feb. Since then it has fallen to a low of $634.50, and presently sits at $653.90.
The horizontal resistance turned support, now turned back again into resistance, at $655-656 - is the line drawn in the sand that gold needs to break above, and stay above; if any sustainable rally is going to occur.
It has its work cut out for it - but gold has lasted through wars, famines, pestilence, and the ages of time - it remains immutable, the ultimate store of wealth. When gold speaks - all tongues remain silent.

Next we have chart of streetTracks gold ETF.

The chart reveals GLD testing its lower trend line going back to Oct.of 2006. So far - so good. If a higher low is kept in place, then a sustainable rally should follow.
Stochastic indicator is turning up from oversold territory with a bullish cross over occurring. The POG is above its 50 ma. We wait with interest to see what the new week brings.
Below is the point and figure chart for gold, based on percentage, not the standard p&f chart. The chart shows a very bullish price projection.
The standard point & figure chart shows a bearish price projection of $585.00.

Silver
Silver closed the week out at $13.22 up 0.24 or +1.89%. It was silver's daily high for the week, and the highest weekly close in 3 weeks. Intra-week silver had an inter-daily high of $13.27.
Silver has still been performing better then gold. The chart below shows silver bumping up against significant overhead resistance. It's time to either break on through to the other side - or retest its lower trend line. We'll go with Morrison.

Next is the central fund of Canada. RSI is turning up, and it looks like a positive MACD crossover is about to occur. Histograms are shrinking back towards zero.
Higher lows have been kept in place; however, as the highlighted area indicates - there is significant overhead resistance or supply, which needs to be worked off before a sustainable rally can occur.

XAU Index
The XAU Index gained 1.27 points to close the week at 133.31 (+0.96%). It was not the week's daily high, which was made on Monday at 133.77.
It was, however, the highest weekly close in 3 months, although there were several higher intra-weekly highs that were made during that same time period.
The chart below shows the stochastic indicator headed up from oversold levels with a positive crossover.
Recently, the gold/xau ratio hit an extremely oversold reading of 5.00, and has since backed off to 4.91. These are very oversold levels, which generally coincide with the beginning stages of rallies.
One thing we do not like on the chart is that the Bollinger Bands are getting wider apart. Presently, the XAU is headed for the middle of the BB at 136.55. There is a good deal of overhead resistance to overcome, and the index has its work cut out for it.

HUI Index
The HUI Index was down -1.33 for the week, closing at 327.01 (-0.37%). It did not close on its high for the week - that was made on Monday at 331.62.
The daily chart shows the Hui has a good deal of overhead resistance to work through. Just by the looks of it - it appears that it will take a few more weeks to get through, however, the gold & silver stocks are thinly traded stocks, and can move quite quickly and strongly on short notice. It doesn't take huge sums to move the gold stocks significantly.

The weekly chart illustrates that the HUI has been in a trading range since March of 2006 - over a year now. On the top of the range sits 401.69 and at the bottom sits 270.00.
The middle of the range is about 285.00. Presently the index is at 327, well above its 65 week ema.

Up next is the monthly chart of the Hui Index. It shows the index just approaching its bottom trend line. A series of higher lows have been kept intact thus far.
However, MACD has recently made a negative downside cross over, and the histograms are accelerating to the downside.

Gold & Silver Stocks
The first up is Agnico Eagle Mines (AEM). We have owned this stock before, and it is one of the best performing of all pm stocks.
RSI shows a positive divergence, and the MACD appears about to put in a positive upward cross over. Histograms are receding towards zero.
There is significant resistance at $38. We are watching for a break above 38, and then waiting for a subsequent correction that holds above that level.

Last up is Hecla Mining. Hecla has also been one of the best performing pm stocks. We recently sold it to book profits, and we are pleased to have been able to do so.
Presently, there are mixed signals as to which way HL is going to go. MACD is very close to either making a positive cross over up, or a negative cross over down. Histograms have just turned negative. For now we wait and watch.

Summary
Stock markets around the world have sold off from recent highs, due to worries over the subprime mortgage debacle, the Yen Carry Trade, and the subsequent selling of just about anything in order to meet margin calls. Liquidity, liquidity, and more liquidity is the name of the game.
The unwinding of yen carry trades has caused the yen to rally, and most other assets to be weak. The dollar is once again headed down, while the euro has turned up. U.S. Treasuries have been a "safe haven" from the turmoil of the stock market.
A short term rally may be in order; however, more downside action appears likely. We believe that a return to the bear market is in the cards to be dealt later this year.
The sub-prime loan problems, the unwinding of the carry trades, as well as the search for liquidity - are all gold positive. The only remedy the Fed has for anything is to create more money and credit.
Many have pointed to the fact that because gold hasn't gone up during such turmoil that it is a sign of weakness. Obviously it's a sign of weakness, as it hasn't gone up.
However, that does not preclude it from going up - nor does it provide any indication how high it will go up, or the timing of such a move up. It's a bull market until it isn't.
As the problems in the monetary, financial, and debt markets unfold, gold will be seen as the only asset that is no one's liability, and it will then shine brightest of all.
We plan on adding to positions when the 65 week ma is near, and we will also be adding to positions in the gold stocks when a higher low is kept intact.
A few words on China are in order. Recently they announced that they would be diversifying out of some of their $1.07 trillion dollars of currency reserves, the largest cache in the world.
With the announcement of a fund being planned to oversee the investment of a good chunk of their reserves, many around the world became concerned that China's purchases of U.S. Treasury Bonds might take a dive.
Prime Minister Wen Jiabao replied by saying, "our purchases of U.S. dollar assets are mutually beneficial, and we won't affect the value of U.S. dollar assets." China is the second largest overseas holder of Treasuries after Japan.
The Prime Minister also said that China's economic expansion, "is unstable and environmentally unsustainable. China's investment growth is too high, lending growth too fast, liquidity excessive and trade and international payments very imbalanced."
China's money supply grew 17.8% in February. They have the highest rate of non-performing loans in the world. Many are worried that China is going to take over the world.
This is all very similar to the talk of Japan taking over the world back in the 80's and 90's. Maybe - maybe not. I'd be more concerned with the elite international banking dynasties rising to power via their New World Order plans and taking over the world - not China.
Lastly, remember the term CDO's - collateral debt obligations. Several years ago I wrote that derivatives and the carry trade would become household words before all was said and done.
You can now add CDO's to that list as well - the worst of the worst. We ain't seen nothing yet. If ever there was ever a time for Honest Money - now is that time.
Invitation
Stop by our website and check out the complete market wrap, which covers most major markets. There is also a lot of information on gold and silver, not only from an investment point of view, but also from its position as being the mandated monetary system of our Constitution - Silver and Gold Coins as in Honest Weights and Measures.
There is also a live bulletin board where you can discuss the markets and other topics with people from around the world, as well as many other resources too numerous to list. Drop by and check it out. Good luck. Good trading. Good health. And that's a wrap.

Come visit our new website: Honest Money Gold & Silver Report
And read the Open Letter to Congress


