


Index Advisor 030
4/16/2007 8:35:40 AM
Recommended Trades:
We are waiting to see the trading action on Monday.
Open Positions:
There are no open positions at this time.
In general, once we have entered a position, we will issue an alert to exit the position. We will note likely target areas for a trade, but we buy and sell on signals, rather than target areas. The same method applies to stops, as we don't use classical stops, but rather rely on the signals generated to reverse or exit our positions.

Overview:
The past week was saw negative economic news result in a late week rally that saw all the major moving averages move higher. It hasn't yet reached its six year highs, and some interesting chart patterns can be observed, which we will review shortly.
The markets seem immune to negative news as the bears have not been able to follow-through in early day efforts to take the market down. Since last summer, the markets have been in rally mode, which makes more sense on a fundamental basis for last year than this year.
By summer of 2006, company earnings were expected to slow down to single digit rates. This was largely responsible for the May through June sell-off in 2006 in anticipation of this slowing. The impressive rally from summer 2006 into February 2007 is largely a result of blow-out numbers. By Q3, the S&P-500 companies over achieved their targets by about 4.5% reporting earnings, on average of around 14%. Even Q4 saw double digit year-over-year growth.
For Q107, consensus estimates for year-over-year growth for the S&P-500 companies, on average, is around 3.5% to 4%. We expect companies to beat these low projections, although with Q106 performance being so strong, it is a difficult benchmark to have too much more upside on.
In addition, economists keep ratcheting down GDP projections, currently around 2% annual growth for Q107. They also continue to raise inflation projections and interest rate projections. Finally, they continue to raise the change of a recession in 2007, with a 26% chance currently assigned.
With all that slowing growth, the bullish argument is simple. Slow growth is still growth. The emphasis on that argument seems to change as it adapts to reports that come in. Initially, the bulls claimed the Fed would lower rates immediately due to the slowing economy. With inflation continuing to climb, the argument is now that the economy will continue to grow, and the Fed won't raise rates soon. Either way, the market seems to be ignoring the reality.
It would imprudent not to discuss market valuation at this point. We agree that the market is not expensive, when considering current interest rates and contrasting P/E ratios with their historical averages. However, we need to compare that to current and expected growth rates. It isn't clear that the growth rates will accelerate as quickly as some market prognosticators argue later this year. If the economy does, in fact, enter a recession, the market is likely overvalued.
We are most concerned about the lack of business investment coupled with the rapid rise in consumer prices for food and energy. If the consumer gets derailed from spending, and the housing market and related financial markets continue to be in a recession, and if businesses don't take up the slack, where does the spending come from that will allow this growth to take place? We don't have the answers, but we think the question needs to be asked and the market is likely to contemplate this sooner, rather than later, as the markets approach their six-year highs in the coming week.
Let's review economic reports and other events that transpired during the week.
Monday: There were no economic reports released on Monday. Alcoa reports on Tuesday after the bell. Friday's payrolls report suggests that the economy is still strong, and that the labor market is tight enough that a Fed reduction in interest rates will have to be put off.
AMD lowered guidance for Q1 but promised to cut capital expenditures by a half a billion dollars in 2007. This saw AMD's largest competitor Intel (INTC) roar 2.7% higher, and even AMD closed higher on the news. However, investors continue to be concerned over near term prospects for tech.
Tuesday: There were no economic reports released on Tuesday. While several analyst upgrades to key tech stocks (ORCL, AMAT, ADSK) supported a rise in equities, bearish news for housing put a damper on things. D.R. Horton (NYSE:DHI) reported a drop of 37% in new home sales. In addition, a report from Equifax/Moody's showed that national mortgage delinquency rate rose to an all time high of 2.87% for Q1. This adversely affected consumer discretionary stocks. Finally, Fed Governor Mishkin warned that the current rate of inflation remains too high, and that the Fed would have to raise rates if price gains don't ease.
Wednesday: The budget deficit increased by $96.3B (consensus was for an increase of $90B) in March indicating Washington hasn't been able to decrease spending growth below the 6% year-over-year rate. The FOMC minutes were released confirming a hawkish bias of Fed members, and verifying that the market got it wrong when there was an expectation for an imminent rate cut.
In an important, but little followed report from the National Association of Realtors (NAR), their monthly outlook indicated that home prices were likely to fall in 2007, for the first time in the thirty-eight years. Since the NAR began tracking this in 1968, the average gain has been 6.5% annually, with the smallest gain being 2.0% in 2006. The excuse is tighter lending standards.
Thursday: Economic reports released Thursday indicated rising March import prices rose 1.7% due to a rise in the price of oil, but core import prices rose only 0.3%. March export prices rose 0.7%. Core (excluding food and energy) year-over-year prices show exports at 4.2% while imports are at around 2.9%. Initial jobless claims rose to 342K versus an expectation of 320K.
Friday: Friday had four economic reports:
- The trade deficit improved more than expected to -58.4B versus -60.5B.
- Michigan Consumer Sentiment came in at a worrisome 85.3 versus an expected 87.5.
- PPI was reported at a 1.0% monthly gain versus an expected 0.7%.
- Core PPI was reported flat to last month, versus an expected 0.2% gain.
The trade deficit reflects an overall improvement but doesn't tend to effect the market when reported. Consumer sentiment is of significant concern and this dip represents a fairly low level of confidence, with concerns about inflation noted. The two PPI numbers are quite different with core inflation unchanged month-to-month, and at a rate of around 1.0%. Of course the problem is that PPI rose 1% for the month, which will cause angst for the Fed and other economists. With significant continual increases in the price of food and energy, inflation is clearly not settling down. If Tuesday's CPI report shows a marked increase in consumer prices, we could be looking at another Fed rate hike sooner, rather than later.
Oil dropped to $63.63 for the week, so is hovering just below the $64 break-out range. Natural gas rose a few cents to close at $7.801.
Market Climate
The markets were weak early on, but strengthened late in the week. All of the major indexes broke up through resistance, but all are showing a bearish pattern as they approach their six-year highs. The bearish pattern is known as an ascending wedge.
Put simply, a line drawn through recent highs forms an upper boundary which represents resistance. The recent lows form a lower boundary which represents support. The slope of the lower line is steeper than the slope of the upper line, so is harder to sustain, generally resulting in a reversal to the downside as support is broken.
A look at the daily chart for the Dow Industrials is represented by the Diamonds ETF (Amex:DIA).

Abbreviations and color key appears below:
Note the following order is Red, Yellow, Green, just like a stop light, so it might be a helpful mnemonic:
Thick Red line represents the 200-day simple Moving Average, (200DMA)
The yellow line represents the 50-day simple Moving Average, (50DMA)
The green line represents the 20-day simple Moving Average, (20DMA)
The light blue line represents the 3-day Moving Average, moved forward three days in time, (3x3MA)
The thick blue line indicates the exponential 13-day Moving Average (13DMA)
Bollinger Bands are abbreviated as BB. There is an upper and a lower Bollinger Band that varies in distance from a central moving average (shown as light red/pink) based on the volatility of stock price movements.
RSI stands for Relative Strength Index. It is an oscillator, which can be used to determine how overbought or oversold a stock may be.
The daily chart shows several important things about the way the DIAmonds are trading:
- The DIAmonds continue in a long term uptrend, continuing to trade above their 200-day moving average.
- Distribution has been evident since late February, in contrast to price action. This is bearish.
- The 50-day moving average is flat with the 100-day moving average just below. If price moves down from here, it is likely the 50-day moving average could achieve a bearish cross of the 100-day moving average.
- The DIAmonds are readying for a bullish cross of their 20-day moving average above their 50-day and 100-day moving averages.
- Friday's candlestick is a hanging man. If this is confirmed with a lower trade on Monday, this could mark a top.
- The ascending wedge is clearly indicated with the thick solid lines.
A break of the upper boundary of the ascending wedge could easily be followed by a retreat and more significant break of the lower boundary. An equally likely scenario is that price will continue upward under the upper boundary and will break lower through the low boundary within about one week. Finally, the DIAmonds could continue to move higher achieving a new six-year high.
The S&P 500 ETF, known as the Spyders (AMEX:SPY) is shown in the daily chart below:

The daily chart for the SPYders is similar to that for the DIAmonds:
- The SPYders continue in a long term uptrend, continuing to trade above their 200-day moving average.
- Distribution has been evident since late February, in contrast to price action. Friday's trading action broke the distribution downtrend line and could mark a change toward accumulation.
- The 50-day moving average is flat with the 100-day moving average just below. If price moves down from here, it is likely the 50-day moving average could achieve a bearish cross of the 100-day moving average.
- The SPYders are readying for a bullish cross of their 20-day moving average above their 50-day and 100-day moving averages.
- Friday's candlestick is a hanging man. If this is confirmed with a lower trade on Monday, this could mark a top.
- The ascending wedge is clearly indicated with the thick solid lines.
A break of the upper boundary of the ascending wedge could easily be followed by a retreat and more significant break of the lower boundary. An equally likely scenario is that price will continue upward under the upper boundary and will break lower through the low boundary within about one week. Finally, the SPYders could continue to move higher achieving a new six-year high.
This week's NASDAQ 100 ETF (QQQQ) Daily Chart is below:

The daily chart shows several important things about the way the QQQQs are trading:
- The QQQQs continue in a long term uptrend, continuing to trade above their 200-day moving average.
- Distribution has been evident since late February, in contrast to price action. This is bearish.
- The 50-day moving average is coincident with the 100-day moving average and both are trending slightly upward. These moving averages provided support where they were coincident with the short term uptrend line.
- The QQQQs are making a bullish cross of their 20-day moving average above their 50-day and 100-day moving averages.
- Friday's candlestick is a hanging man. If this is confirmed with a lower trade on Monday, this could mark a top.
- Friday's trading resulted in a tweezer top candlestick formation at resistance. That resistance is at the price level that "closes the window" established on the gap lower on Black Tuesday in late February.
- The ascending wedge is clearly indicated with the thick solid lines.
A break of the upper boundary of the ascending wedge could easily be followed by a retreat and more significant break of the lower boundary. An equally likely scenario is that price will continue upward under the upper boundary and will break lower through the low boundary within about one week. Finally, the QQQQs could continue to move higher achieving a new six-year high.
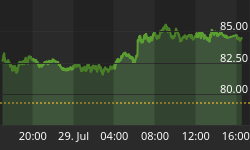
This week's Russell-2000 ETF (Amex:IWM) Daily Chart is below:

The daily chart correlates well with the charts of the other major indexes, and has some
- The IWMs continue in a long term uptrend, continuing to trade above their 200-day moving average.
- Distribution has been evident since late February, in contrast to price action. Friday's trading action broke the distribution downtrend line and could mark a change toward accumulation.
- The 50-day moving average is trending parallel to the 100-day moving average and both are trending slightly upward. The 50-day moving average provided support where they were coincident when price dipped back to it in the last week.
- The IWMs are making a bullish cross of their 20-day moving average above their 50-day moving average.
- Friday's candlestick is nearly a hanging man (the body is too long to qualify). If this is confirmed with a lower trade on Monday, this could mark a top.
- Friday's trading resulted in a break above resistance, which we indicated last week was at $81.20 (the IWMs closed Friday at $81.40).
- The ascending wedge isn't clean, with price often moving outside. The thick black line indicates another boundary line that could be broken with a strong upward move. Either way, a break higher would be considered bullish.
- The upper Bollinger Band will come into play on a move higher and may prove to be a logical reversal area.
The immediate path for the IWMs appears higher with a test of the six-year high likely. We expect that this will occur in the coming week. We also expect this challenge to fail and the IWMs will begin a move lower shortly. An effective entry on a failure of this attempt should result in a juicy short trade.
Finally, we continue to monitor the semiconductor index. The chart appears below:

We have previously noted the semiconductors as an important element of tech and that this has significant influence on the NASDAQ. Historically, tech has moved the markets higher or lower and when it is doing well, is often an early sign of the markets health.
The chart for semiconductors indicates a lack of health at this time. In fact, price continues in a shallow uptrend channel, but is dangerously close to breaking below this level. Friday's open was at resistance and moved down from there, even with the late day rally. While many market pundits are bearish on tech at this time, it signifies a lack of investment by businesses, which we discussed in the overview section. This can not be a good thing for the markets.
Conclusion:
While we can's say with any certainty when the markets will fail, we believe this failure will occur within the month, as the ascending wedge patterns will be close to closed and price action would have to be in an extremely tight range by then. With the bearish news being ignored by investors, the markets continue to be bid higher. We believe that this will likely see an ugly reversal to the downside if sentiment shifts.
With that said, let's reflect a moment on the incredibly strong uptrend that occurred from summer 2006 until late February. It was an anomaly with no pullback of even 2% occurring on the Dow or S&P-500 for eight months. This sort of behavior hadn't been seen in nearly 50 years! This means that behavior in the markets is somehow different. Why is that the case?
We believe that the incredible performance of the markets was due to several things. First, the earnings results of companies showed double digit growth (year over year) for fourteen consecutive quarters, which is quite a strong trend. Second, the cash that companies were able to amass during that time allowed a large percentage of companies to announce and fund stock buy backs which powered these stocks higher. Finally, the incredible amount of global liquidity has allowed the markets to move higher. We expect that as central banks continue to raise their interest rates, this will remove this liquidity and put a damper on upward moves.
Are we bearish on prospects going forward? We are not as bullish as many market pundits. We believe that the fundamentals in the market remain positive but challenging and market participants have enjoyed the move upward and are currently discounting bearish signs. When these are eventually factored in, we believe that investors will want to migrate away from risk, which will move equities lower.


