


Today had some of the worst internal readings on record, and cumulatively, the worst I've ever seen. For those of you wondering where the PPT was, let me tell you, this market should have crashed today, should have lost 10 percent or more. Somebody kept a safety net under certain disaster. When you see the internal readings here tonight, you'll see what I mean. The Dow Industrials plunged 450 points, then recovered a third of the loss, finishing down 311.50 points, to close at 13,473.57 Thursday. NYSE volume was 156 percent of its 10 day average, and was the highest on record at 5.4 billion shares, with downside volume leading at a selling panic 94 percent, declining issues at 91 percent, with S&P 500 downside points leading at 96 percent -- another 90 percent down day . We saw distribution today, which is normally the flow of stocks from strong hands to weak hands, however, it looked to me as though it went from strong hands to PPT hands. Guess what? If so, they did their job.
We sit Thursday with eight Hindenburg Omen observations since mid-June. This is a sign of an unhealthy market, especially considering we just hit new all-time highs last week, but not totally unexpected at an Intermediate wave 1 top, a significant top, which occurred on a closing basis at DJIA 14,000 last Thursday. As a reminder of a cyclical concern we presented several months ago, there is a decennial pattern where years that end in 6 or 7 have seen major declines over the past century. There was no significant decline in 2006, so we are due, and appear to be in the throes of one. With Intermediate wave 1 up complete, the 2007 decennial decline is Intermediate degree wave 2. Wave 2 could last only a few months if severe and in the form of a crash, or could last into early 2008.
Since our recent phi mate turn date, which occurred on Thursday, July 19th, 2007 at DJIA 14,000, the Dow Industrials have dropped 665 points. What bothers us is that we do not have another phi mate turn date until October. That doesn't mean we cannot have a major turn between phi mate turn dates, but it would be rare. Thursday's action eliminated the Bullish Elliott Wave scenario, thus Intermediate wave 2 down has started (Rule: wave four cannot enter wave one's territory).
S&P 500 Demand Power fell 10 points to 374, with Supply Pressure rising an incredible 21 points to 443, telling us Supply hit the market hard, but somebody was buying to prevent a bloodbath, as Demand Power fell only half of the Supply that hit the market. The DP/SP indicator remains on an "enter short positions" signal from July 24th, as Demand Power fell more than 10 points below Supply Pressure.
NYSE New 52 week Highs fell to 31, with New Lows rising to one of the highest readings of all-time at 809 Thursday, the lower of the two is below the 2.2 percent threshold necessary for another Hindenburg Omen observation. Markets are operating on the clock of a confirmed Hindenburg Omen signal, meaning there is a far greater than normal risk of a significant decline between now and the first week of October. That decline started Thursday, July 19th, our phi mate turn date of July 20th +/- a few days. We also showed a Fibonacci Cluster occurring at this time, a small Cluster of former tops and bottoms that are a Fibonacci number of trading days away from the five day window from July 18th through July 24th, arguing for an important turn coming now, which has proved prescient.
Let's talk about the 809 New Lows Thursday. I could only find 7 instances over the past 20 years when it was worse: July 24th, 2002 had 917; October 8th, 1998 had 930; August 27th through 31st, 1998 saw 991, 813, and 1,183; And October 19th and 20th, at the stock market crash of 1987 saw 1,058 and 1,174. Most of the time, prices continued to drop further over the next two weeks, before rallying back. Even when 9/11 hit, we saw less New Lows than occurred Thursday, July 26th, 2007.
We try to be objective with this newsletter service, and simply call the short and intermediate-term trend turns, or identify the risk thereof, as best as is possible. Last week we saw a long opportunity, and took it, then closed out our Traders Corner Position Tuesday, July 17th, realizing an 88 percent profit in four trading days. We were happy with the profit and saw increasing risk of a top within the next few days as the phi mate turn date approached, so got out.
Thursday's McClellan Oscillator fell to an extreme oversold negative -332.41, with the Summation Index falling to positive + 623.45. Wednesday's small change in the M.O. suggested a large price move was coming Thursday or Friday. That proved to be true. Again, in researching the past twenty years, I could only find four instances when the McClellan Oscillator had a worse negative reading: March 23rd, 2005 reached -336.84; May 10th, 2004 saw -363.53; and just after September 11th, 2001's terrorist attack, we saw readings of -362.74 and -385.92. In most of these instances, we saw prices drop a bit more after these readings before a recovery. This is remarkable when we consider that we hit new all-time highs in both the Dow Industrials and the S&P 500 just last week. Of course, this is a sign of an extremely unhealthy market.
The percent of DJIA stocks above their 30 day moving average fell to 40.00 Thursday from 53.33 Wednesday. The percent above 10 day fell to an oversold 13.33 from 40.00. The percent above 5 day fell to an oversold 10.00 from 30.00.
The Weekly MACD reading is very close to generating a new "sell" signal. If it does, we might consider shorting at the next corrective rally inside this multi-month Intermediate Wave 2 decline that has started. There is a sweet spot coming, for Bears, a sub-degree wave three down, within wave 2 down. That is a great place to short, after the current decline completes, and its corrective rally approaches completion, maybe in a week or two. A lot of damage can occur when indicators are oversold, but the coming short-term corrective rally will do its best to work off some of the ridiculous internal readings sitting here Thursday evening. Then more damage, worse than this week's, will arrive.
Our three Blue Chip key trend-finder indicators (other than the Demand Power/Supply Pressure Indicator) remain on a "sell" signal Thursday. The DJIA 30 day Stochastic Fast came in at 40.00, below the Slow at 56.00, remaining on a "sell" signal from July 18th. The DJIA 14 day Stochastic Fast fell to 23.33, below the Slow at 48.89, remaining on a "sell" signal from July 18th. The S&P 500 Purchasing Power Indicator plunged an incredible 17 points to 105, remaining on a "sell" signal from July 24th. The stochastic indicators measure breadth momentum, and the PPI measures supply/demand momentum.
Our other Blue Chip indicator, the NYSE 10 day average Advance/Decline Line Indicator worsened to an unbelievable negative -954.8, remaining on a "sell" signal from July 18th. I can't remember a reading that low.
We need to take note that the PPT Intervention Indicator rose sharply again Thursday to positive + 33.87 as short-interest explodes. This can become short-term bullish, as it is fodder for the PPT to intervene and kick off a short-covering rally, however in the case of Thursday's "should have been" crash, it had the effect of minimizing what could have been catastrophic price damage.
The Plunge Protection Team Intervention Risk Indicator is back on a "buy" signal after rising above the positive + 20.00 threshold, although maybe it should be called a "sell mitigated" signal, given the huge downside risk in the markets here. Rallies often occur when this measure is above positive + 20.00 or below negative -16.00. The DJIA Call/Put Ratio fell to 0.98, moving to a "neutral" reading, below 1.00 (moving below 1.00 and above 1.40 is neutral, while rising decisively above 1.00 -- above 1.10 -- triggers a new "buy"). The Secondary Trend Indicator fell 8 points to negative -18, remaining in neutral territory. A rise above + 30 would trigger an intermediate term "buy." A drop below negative -30.00 would trigger an intermediate term "sell."
The NASDAQ 100 fell 24.54 points to close at 1,986.60 on Thursday. Volume was huge at 149 percent of its 10 day average, with downside volume leading at 86 percent, with declining issues at 88 percent, and with downside points leading at a 89 percent. NDX Demand Power fell 5 points to 401, with Supply Pressure rising10 points to 417, telling us a mountain of supply hit the markets, but someone came in and bought, supporting markets from disaster as DP fell only half what SP rose. The DP/SP indicator triggered an enter short positions signal Thursday, as the SP measure crossed over the DP measure by more than 10 points. Our key trend-finder indicators remain on a "sell" signal Thursday. The NDX 14 day Stochastic Fast fell to 25.00, below the Slow at 45.60, remaining on a "sell" signal from July 23rd. The NDX Purchasing Power Indicator plunged 7 points to 153.67, remaining on a "sell" signal from July 24th. The NDX 10 day average Advance/Decline Line Indicator fell sharply to negative -19.4, triggering a new "sell" signal. Primary degree wave {C} down has started.
The Russell 2000 got crushed, down 21.02 points, closing at 791.48. Volume was huge at 145 percent of its 10 day average, with downside volume leading at 85 percent, with declining issues leading at 88 percent. The RUT Purchasing Power Indicator plunged 16 points to 73.92, remaining on a "sell" signal from July 20th. The RUT 10 day average Advance/Decline Line Indicator worsened to a ridiculous negative -544.9, remaining on a "sell" signal from June 25th.
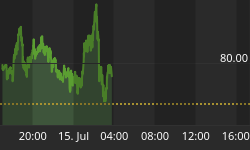
The HUI Amex Gold Bugs Index finally got caught in the stock downdraft, dropping 12.79 points, closing at 345.79. It needs another down-leg before another breakout north. Still, it is headed higher in a big way over the next year (intermediate term, not necessarily short-term). Volume was huge at 141 percent of its 10 day average, with all issues declining. Our key trend-finder indicators generated a new "sell" signal Thursday. The HUI 30 day Stochastic Fast dropped to 57.89, decisively below the Slow at 87.13, generating a new "sell" signal Thursday. The rule is, the Fast must drop 20 points below the Slow for a new "sell." The HUI Purchasing Power Indicator fell to 175.34, remaining on a "sell" signal from July 25th. Gold closed down at 662.5. Silver closed down at 12.87, and Oil closed down at 74.91. The Dollar fell 0.19 to 80.46. Bonds rose a point in a flight to quality, rising to 109^29, and we've been forecasting this rally in Bonds for several months. The VIX rose 2.64 to 20.74 as fear grips the options world.
The Australia SPASX200 fell 82.00 points, or 1.29 percent on Thursday, July 26th. For details, click on the Weekend Australia report, which includes an EW chart of the FTSE.
Bottom Line: Major trend reversals are expected, by late summer; Down in equities, and up in precious metals. Also later in 2007, Bonds should rally hard. The confirmed Hindenburg Omen warns of a larger than normal risk of a significant decline in equities by October, which has likely started.
"Behold, I stand at the door and knock; if any one hears
My voice and opens the door, I will come in to him."
Revelation 3:20
For a FREE 30 Day Trial, go to
www.technicalindicatorindex.com and click on the
button at the upper right of the home page.


