


9/6/2007 7:10:43 AM
Here is today's Daily Stock Barometer. Note we've tweaked the barometer to make the signal quicker to respond to direction changes in the market and we provide the spread indicators on a daily basis. There are instructions for subscribing below if you'd like to resume your subscription for the next few months, which are normally the most exciting in the stock market...
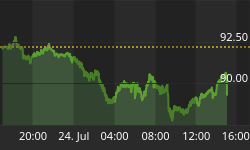
Is the market topping here?

Stock Barometer Analysis
The barometer remains in Buy Mode and is getting extended to the upside here.
The Stock Barometer is my proprietary market timing system. The direction, slope and level of the Stock Barometer determine our outlook. For example, if the barometer line is moving down, we are in Sell Mode. A Buy or Sell Signal is triggered when the indicator clearly changes direction.
Stock Barometer Cycle Time
Today is day 3 in our Up Cycle.
The Stock Barometer signals follow 5, 8, 13, 21 and sometimes 34 day Fibonacci cycles that balance with 'normal' market cycles. Knowing where you are in the current market cycle is important in deciding how long you expect to maintain a position.
Potential Cycle Reversal Dates
2007 Potential Reversal Dates: 1/10, 1/14, 1/27, 1/31, 2/3, 2/17, 3/10, 3/24, 4/21, 5/6, 6/15, 8/29, 10/19. We publish these dates up to 2 months in advance.
There still is the potential that the market will continue higher into 10/19, however, we'll need to see a bit of a retracement before hand. Most likely in this seasonally weak period ahead.
My Additional timing work is based on numerous cycles and has resulted in the above potential reversal dates. These are not to be confused with the barometer signals or cycle times. However, due to their past accuracy I post the dates here.
2006 potential reversal dates: 1/16, 1/30, 2/25, 3/19, 4/8, 5/8, 5/19, 6/6(20), 7/24, 8/20, 8/29, 9/15, 10/11, 11/28. 2005 Potential reversal dates based on 'other' cycle work were 12/27, 1/25, 2/16, 3/4, 3/14, 3/29, 4/5, 4/19, 5/2, 6/3, 6/10, 7/13, 7/28, 8/12, 8/30-31, 9/22, 10/4, 11/15, 11/20, 12/16.
The following work is based on my spread/momentum indicators for the QQQQ, GLD, USD, USO and TLT. They are tuned to deliver signals in line with the Stock Barometer and we use them only in determining our overall outlook for the market and for pinpointing market reversals. The level, direction, and position to the zero line are keys in these indicators. For example, direction determines mode and a buy signal 'above zero' is more bullish than a buy signal 'below zero'.
QQQQ Spread Indicator (NASDAQ:QQQQ)

The QQQQ Spread Indicator will yield its own buy and sell signals that may be different from the Stock Barometer. It's meant to give us an idea of the next turn in the market.
Gold Spread Indicator (AMEX:GLD)

To trade Gold, utilize the Gold ETF AMEX:GLD. This gives us a general gage to the overall health of the US Economy and the markets, as well as to assists us in the entry of positions in our stock trading service.
US Dollar Index Spread Indicator (INDEX:DXY)

To trade the US Dollar, I'd utilize the Power Shares AMEX:UUP: US Dollar Index Bullish Fund and AMEX:UDN: US Dollar Index Bearish Fund.
Bonds Spread Indicator (AMEX:TLT)

To trade Bonds, I recommend Lehman's 20 year ETF AMEX:TLT. Note that the direction of bonds can have an impact on the stock market. Normally, as bonds go down, stocks will go up and as bonds go up, stocks will go down.
OIL Spread Indicator (AMEX:USO) *NEW*

To trade OIL, utilize AMEX:USO, the OIL ETF. We look at the price of oil as its level and direction can have an impact on the stock market.
Supporting Secondary Indicator

I monitor over a hundred technical indicators, some that are widely followed and some that are proprietary. These indicators break down the market internals, sentiment and money flow and give us unique insight into the market. I feature at least one here each day in support of our current outlook - and to give you an education on what professional traders utilize.
Summary of Daily Outlook
We remain in Buy Mode as the barometer moved higher even as the market moved lower. The expectation over the longer term as we look at the next key reversal date of 10/19 is for the market to move lower, especially given the high barometer reading. However, note that the market can reset itself and position for a move higher with a nice retracement. So as much as the market likes to bottom in October, never rule out the opposite action in the market.
While I haven't discussed the above spread indicators, it's nice to watch how they line up and could influence the stock market. We've also provided a little guidance on how to trade them. These are not aggressive vehicles, but if you're looking for exposure to the dollar, gold, oil and bonds, they sure come in handy. With each of the indicators, we provide two lines - an intermediate and a short term line. If you're going to trade these, you need to understand the relationship between the short and mid term moves. Oil is a good example, as it's getting extended on a short term basis and should consolidate, however, it's mid term line is moving high and closing in on the zero level. What happens here will be significant for oil going forward. Combine these signals with basic technical analysis, and you should be in a good position to trade them. Let me know if you have any questions.
Continue receiving buy and sell signals and trading advice on the QQQQ, Gold, Bonds and Oil for only $24.95/month CLICK HERE before your free trial ends.
Save 20% by subscribing for a year for only $239 (click here).
If you have any questions or comments, email me at Jay@stockbarometer.com.
Regards,


