


LET'S LOOK AT THE S&P 500 INDEX

Last week I though we could see a rally into the 8th of March provided it could stay out of the congestion at 1369. That didn't occur and the index collapsed into Tuesday. So the rally never appeared. The move up on Wednesday was a weak rally and now with yesterday's move down there is a one day counter trend in place which does indicate the possibly of a capitulating or panicking trend down.
Because the index did not get back above the previous high and has set in a lower high with a SPACE between the last low and the rally high the odds favor the current leg down is still intact and will like go to marginally below the exhaustion low. And that will complete the first leg down in this bear trend. A rally will follow of 60 or 90 calendar days but will be a counter trend rally. Prior to my seeing the rally that didn't exists the forecast was for a marginally higher low or marginally lower low. Then a major counter trend rally followed by a resumption of the down trend. I thought the 34 day cycle for high on the 26th of February would only bring in a consolidation of the move up and not a reversal. So I'm not very confident I have the time vibration understood at this juncture. This is a fast move down following a sideways pattern and because of the capitulation style of trend it will need to exhausts into the low and should be obvious. Prices could be 1254 to 1260 or 1232 to 1238. It did close on the low and many times that is a temporary exhaustion but with the last rally at 11 days, as you can see, the weakest rally during the entire decline there could be another panic down to marginally below the January low. Consensus is down to levels for a low but is not precision timing.
LET'S LOOK AT THE FTSE DAILY CHART

You can see this is the same basic picture only it is still holding the obvious support. But showing a one day counter trend at the "obvious" is a set up that can be followed by a fast move down. Previously I had indicated today the 8th would be a cycle that could bring in a significant low but cycles represent a probability and the pattern of trending is reality and that appears quite scary at this time due to the one day rally. There will be another thrust down due to the internal markets. The key will be what occurs the next trading day and what occurs in the NASDAQ.
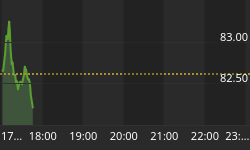
LET'S TAKE A QUICK LOOK AT THE NASDAQ

The pattern of trending is showing 4 rallies each weaker than the previous. Something that logical would make one believe a panic move down could start. When this pattern shows up at a high level it is an extremely bearish pattern and indicates distribution. Showing up after the index has an exhaustion doesn't have the same bearish probability and could (?) represent a struggling move down toward the exhaustion low for a low. So it is not as scary as it might appear except for the one day rally that is failing. Follow through to the downside after another down day would present a panic in progress. Holding around this level would show a struggling trend down to establish a low against the exhaustion low.


