"No warning can save people determined to grow suddenly rich" - Lord Overstone
 |
Gold •752 days | 2,368.70 | +35.30 | +1.51% |
 |
Platinum •10 mins | 1,604.10 | -4.70 | -0.29% |
|
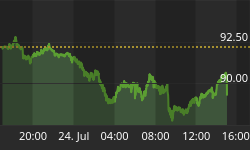
WTI Crude •1 day | 89.31 | -2.88 | -3.12% |
|
Gasoline •1 day | 3.396 | -0.101 | -2.87% |
|
Ethanol •752 days | 2.161 | +0.000 | +0.00% |
|
Silver •752 days | 30.82 | +1.16 | +3.92% |
 |
Silver • 752 days | 30.82 | +1.16 | +3.92% | |
|
Copper • 752 days | 4.530 | +0.111 | +2.51% | |
|
Brent Crude • 1 day | 96.78 | -3.91 | -3.88% | |
|
Natural Gas • 1 day | 2.871 | -0.045 | -1.54% | |
|
Heating Oil • 1 day | 4.181 | -0.161 | -3.71% |
Gerald Hoopes

Contributor since: 26 Feb 2010
-
More on the Coppock Curve Buy Signals of 4/28/78 & 5/30/03
My June 6 communication showed that the 8 deep and very deep Monthly DJIA Coppock Curve buy signals occurring after 12/1/61 comprise 4 distinct pairs…
-
The Coppock Curve Buy Signals of 4/28/78 and 5/30/03
A previous communication showed that the two deep Monthly DJIA Coppock Curve buy signals of 4/28/78 and 5/30/03 were the only ones since the 1920's…
-
Smoothed CI-NCI Ratio and the Coppock Curve
In my previous communication I pointed out a weakness in our using Peter Eliades' daily CI-NCI Ratio as a leading indicator of deep and very…
-
A Connection Between the CI-NCI Ratio and the Coppock Curve?
The Monthly DJIA Coppock Curve has dropped below -125 into what I call "deep territory" 13 times since 1926, with the 13th occurrence coming on…
Sign up to the
Safehaven Market Insider


