 |
Gold •589 days | 2,368.70 | +35.30 | +1.51% |
 |
Platinum •10 mins | 2,000.10 | -145.60 | -6.79% |
 |
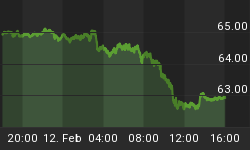
WTI Crude •11 mins | 62.93 | -1.70 | -2.63% |
 |
Gasoline •13 mins | 1.917 | -0.062 | -3.14% |
 |
Ethanol •589 days | 2.161 | +0.000 | +0.00% |
 |
Silver •589 days | 30.82 | +1.16 | +3.92% |
 |
Silver • 589 days | 30.82 | +1.16 | +3.92% | |
 |
Copper • 589 days | 4.530 | +0.111 | +2.51% | |
 |
Brent Crude • 11 mins | 67.61 | -1.79 | -2.58% | |
 |
Natural Gas • 11 mins | 3.204 | +0.045 | +1.42% | |
 |
Heating Oil • 11 mins | 2.393 | -0.047 | -1.93% |

Hubert Moolman
Contributor since: 18 Apr 2010
-
The US Dollar Breakdown Clears The Way For A 70s Style Silver Rally
The apparent breakdown of the US Dollar Index is setting silver up for a spectacular rally. In fact, it could rally like it did in…
-
How Silver Could Rally Significantly Over The Coming Months
The silver price and the US Dollar/South African Rand exchange rate (USD/ZAR) have a very interesting relationship that goes back a long way. In the…
-
Silver Likely To Rise In A Concentrated Manner
The long-term view of silver is extremely bullish, given that it is one of the most undervalued metals, today. It is evident that ideal economic…
-
Gold and Silver: Boom or Bust?
Gold and silver prices are at a critical point. It appears that we will see massive price movements up or down, soon. Conditions are very…
-
Silver Is Looking Really Bullish In Dollars, Euros and Rands
Silver in South African Rand The South African rand is often a leading indicator for where silver (in dollars) is going, as previously explained. Furthermore,…
-
Gold Bull Market Still Intact, But...
The gold bull market is still very much intact. In fact, it appears that the all-time high could be taken out real soon. However, on…
-
Silver Price Forecast: Higher Silver Prices For Many Years To Come
In a previous article, I highlighted how a Head and Shoulders Bottoming pattern on the silver chart suggested that the silver rally since the beginning…
-
Silver Measures Wealth While Gold Stocks Increase It
Silver is one of the goods with the most potential to rise in value over the remaining years of this decade. While silver increases in…
-
Gold In Excess Of $8000 While US Dollar Collapses
The US Dollar Index is not a measure of the value of the US dollar relative to gold. However, there is a relationship between the…
-
This Suggests That Silver Will Soon Spike Significantly Higher
The silver price and the US Dollar/South African Rand exchange rate (USD/ZAR) have a very interesting relationship that goes back a long way. Basically, in…
-
Gold Is Now On Its Way To All-Time Highs
I have compared the performance of the current gold bull market (since 2001) with the 70s one. Below is that comparison (chart from barchart.com): During…
-
Silver Is Insurance Against The Worst Part Of This Depression
The worst part of the world's ongoing financial crisis is still on the way: A crisis that has its roots in the debt-based monetary system.…
-
More Deflation Ahead: Silver, Gold And Their Mining Stocks A Must-Have
Are you ready for the next leg of deflation? Where the real pain will be felt (mainly) because the collapse of commodities and oil, in…
-
This Confirms The Continuation Of Silver's Rally
On the silver chart, is a classical major reversal pattern referred to as a Head and Shoulders Bottom. Major reversal patterns form after a downtrend,…
-
Repeat Of 70s Pattern Shows That A $675 Silver Price Is Realistic
In my previous silver article, I highlighted a very bullish pattern/fractal on the 100-year silver chart. It was a very big picture view of silver,…
-
Get Gold At $356 Per Oz By Buying Silver Today
Gold is currently trading at around $1 370 an ounce. I like gold, but for me that is too expensive, even although I think it…
-
Silver Will Move Much Higher And Faster Than Most People Think
Historically, the silver price has a tendency to decline and rise way more and faster than most people expect. The recent 5-year decline is a…
-
Gold's Final Warning of Impending Monetary Collapse
Gold is currently trading in excess of $1300 an ounce. This is well above the 1980 all-time high. However, this is an incomplete representation of…
-
Major Debt and Dow Collapse Will Set Ideal Conditions For Silver
The current silver bull market is similar to the bull market of the 70s in many ways. Despite the similarities, silver will ultimately perform much…
-
These Conditions Ensure That Gold Stocks Will Continue To Rise Over The Coming Years
Gold stocks need very specific conditions in order to perform well. The last time most of these conditions were present was during the Great Depression.…


