 |
Gold •583 days | 2,368.70 | +35.30 | +1.51% |
 |
Platinum •15 mins | 2,099.40 | +28.80 | +1.39% |
 |
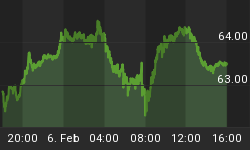
WTI Crude •14 hours | 63.55 | +0.26 | +0.41% |
 |
Gasoline •14 hours | 1.953 | +0.027 | +1.38% |
 |
Ethanol •583 days | 2.161 | +0.000 | +0.00% |
 |
Silver •583 days | 30.82 | +1.16 | +3.92% |
 |
Silver • 583 days | 30.82 | +1.16 | +3.92% | |
 |
Copper • 583 days | 4.530 | +0.111 | +2.51% | |
 |
Brent Crude • 13 hours | 68.05 | +0.50 | +0.74% | |
 |
Natural Gas • 14 hours | 3.422 | -0.087 | -2.48% | |
 |
Heating Oil • 14 hours | 2.413 | +0.020 | +0.84% |

Marty Chenard
Contributor since: 26 Feb 2010
Biography
Marty Chenard is an Advanced Stock Market Technical Analyst that has developed his own proprietary analytical tools and stock market models. As a result, he was out of the market two weeks before the 1987 Crash in the most recent Bear Market he faxed his Members in March 2000 telling them all to SELL. He is an advanced technical analyst and not an investment advisor, nor a securities broker.
-
Why the Bears Were the Dominant Power After September 16th
What could have told you that the market would drop after September 16th? Today, we will post two charts ... one chart of the S&P…
-
Is the Market Bias Negative or Positive now?
Today we will share a chart that we post on Section 4 of our Standard Site every morning. This seemingly simple chart answers a lot…
-
Are You Being a Neurotic Investor?
Be clear, plan your investment strategy, and follow your plan. A very large number of investors have one portfolio but frustrate themselves with trying to…
-
The Danger of Not Analyzing Data to Scale ...
Below is a chart showing the daily number of our unweighted S&P 500 stocks that are showing Negative Strength. If you are analyzing the market,…
-
What's Happening to the VIX's Dangerous 'Circle Pattern'?
Every couple of years, this "Circular VIX Pattern" has been showing up. It is a pattern where you can draw a circle off the VIX…
-
What You Need To Know About the Volatility Index, Otherwise Referred To as the VIX - Part 2
How to Use Technical Analysis on the VIX to know when the market will change direction. In Part 1, we discussed how the VIX moved…
-
A New Danger Courtesy of the Government?
For months, we had pointed out the very large, two year negative divergence that the Financials had relative to the S&P 500. As discussed, the…
-
What You Need To Know About the Volatility Index, Otherwise Referred To as the VIX - Part 1
Part 1: Why is the VIX (Volatility Index) an Important tool for Investors? The VIX explained: Few really know what the Volatility Index is or…
-
Where Have All the Leadership Stocks Gone?
They are called Leadership Stocks for a reason. They lead the market up, and they lead it down. Leadership stocks are those select group of…
-
What Should Be On Your Radar Screen Next?
The large drop in the market was not a surprise to our paid subscribers because we issued a Special Report on May 16th. showing why…
-
Aftershocks From a Nervous Market ...
By now, you know why I like the Institutional Index of "core holdings". It is because it is not really an index, and it represents…
-
Update of: Is it Time to be Concerned?
Do you remember our postings on July 29th, and August 3rd.? The title was "Is it time to be Concerned?" Based on our analysis of…
-
Analyzing the Market When It Is Severely Oversold or Overbought
Investors know that markets can stubbornly stay in an oversold or overbought condition for a long time. So, how can you analyze the the degree…
-
Is Congress Fiddling While Rome Burns?
I'm starting to think this is ironic ... The country is in debt and the Government's revenue cannot cover the current debt. In other words,…
-
Is it Time to be Concerned?
Last week, we posted an analysis of the NYSE's daily New Highs. Let's continue that exploration from a different angle so we can see the…
-
Will an Important Market Decision Happen Soon?
Is this Indicator saying that an Important Market Decision will happen soon? Today's chart shows the daily "New Highs" for the New York Stock Exchange.…
-
Update: Keep an Eye on this Rare VIX Pattern ...
Update on last week's rare VIX pattern appearing again ... Last week's comments are found first, followed by today's comments below ... Last week's comments:…
-
Panic Levels, the VIX, and the NYSE New Lows...
Many regard the VIX as a measurement of fear and panic levels in the market. But, how do you really know what the fear level…
-
A Rare VIX Pattern is Appearing Again...
Today's 12 month VIX chart shows a pattern that is fairly rare. This chart pattern has appeared a number of times in the past and…
-
Are We Going to Make the Protectionism Mistake Again?
Last week, we posed the following question: "Will China help our struggling economy?" At that time we commented that: "Some investors have the idea that…


