"No warning can save people determined to grow suddenly rich" - Lord Overstone
 |
Gold •758 days | 2,368.70 | +35.30 | +1.51% |
 |
Platinum •10 mins | 1,658.70 | -1.50 | -0.09% |
|
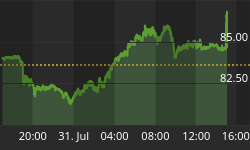
WTI Crude •8 hours | 84.67 | +1.08 | +1.29% |
|
Gasoline •8 hours | 3.114 | -0.017 | -0.55% |
|
Ethanol •758 days | 2.161 | +0.000 | +0.00% |
|
Silver •758 days | 30.82 | +1.16 | +3.92% |
 |
Silver • 758 days | 30.82 | +1.16 | +3.92% | |
|
Copper • 758 days | 4.530 | +0.111 | +2.51% | |
|
Brent Crude • 7 hours | 87.93 | +1.05 | +1.21% | |
|
Natural Gas • 8 hours | 2.747 | -0.011 | -0.40% | |
|
Heating Oil • 8 hours | 4.122 | -0.088 | -2.09% |
Rhody

Contributor since: 26 Feb 2010
-
Gold and Silver Lease Rate Manipulation
This appears to be new on Kitco as of Jan 18, 2006. Perhaps the most interesting graph is at the bottom. For those of you…
Sign up to the
Safehaven Market Insider


