Bitcoin investors have endured plenty of misery this year after the leading digital currency crashed spectacularly. It would be nice for once to report that the selloff is done, and the market is ready for a huge leg up.
Unfortunately, the charts seem to be telling a different story.
When financial instruments crash, they usually go down in stages. These stages are price ranges when the asset temporarily stops and maintains some semblance of stability before repricing to another level. Markets do this on the way up and also on the way down. Once the market has stabilized, a break away from the current range becomes highly likely to produce a sizeable move.
And, bitcoin looks ready for another leg down.
The gains made by bitcoin at the end of last week appear to have fizzled at the beginning of this week.
The digital currency has lost steam shortly after establishing an intraday high of 3640-fiat on three occasions in December. On Monday, it dropped nearly five percent, confirming a weak bullish sentiment around that resistance area. At the time of this writing, it appears to have located support around the rising trendline and is now trading at $3,250.

(Click to enlarge)
Source: bitcointicker.co
Zooming out of the chart, BTC/USD rate is seen trending inside a $450-wide descending channel (in purple). At the time of press, BTC/USD is reversing from the upper trendline thus creating a potential short opportunity. On the flipside, a bounce off the lower trendline creates a long opportunity.
Over a longer timeframe, bitcoin appears to be breaking south for the next down leg.
There’s a high probability that the spike down is the start of another drop. Volatility is high at the current level, signaling a bearish state. If this fall continues, prepare for another capitulation.
Wall Street Cheat Sheet

(Click to enlarge)
Source: CoinDesk
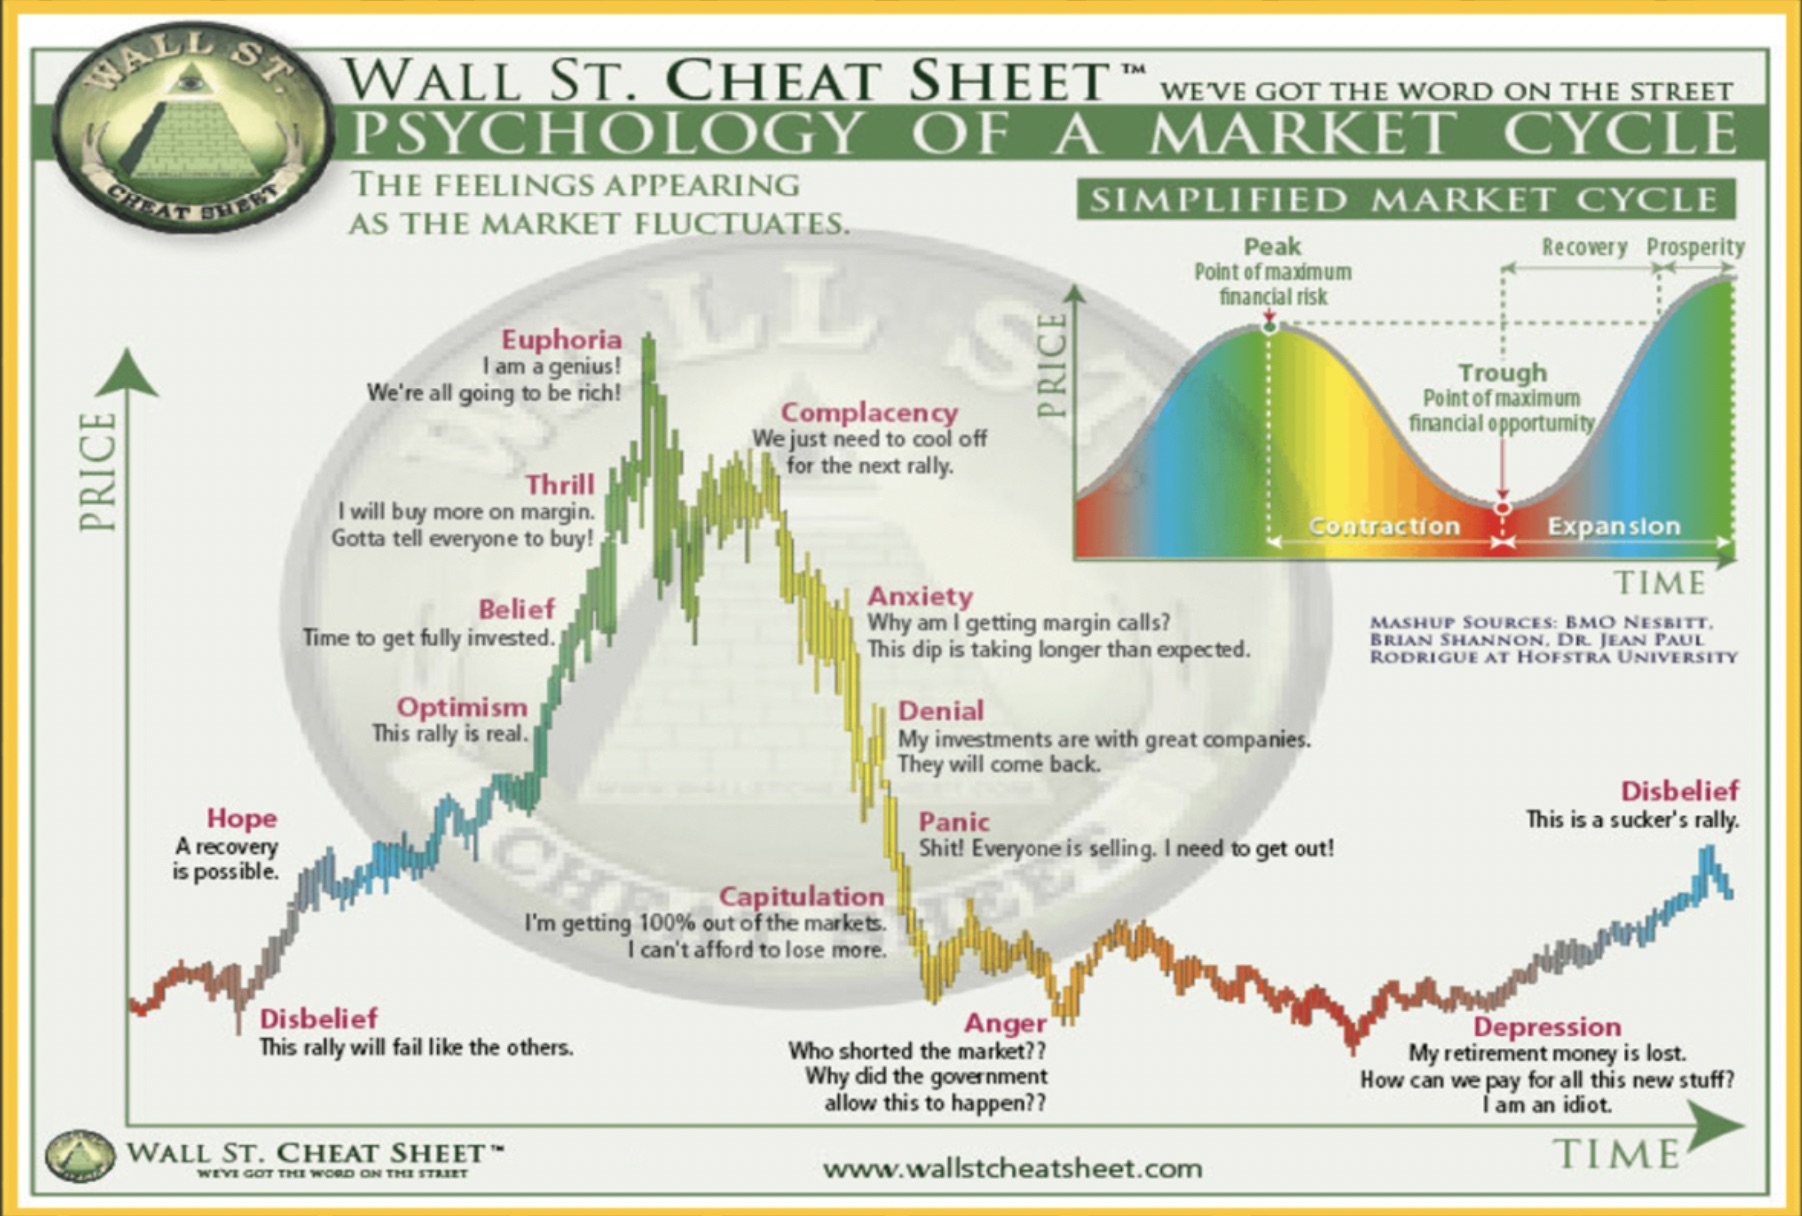
Bitcoin’s sad tale can be explained using a chart known as the Wall Street Cheat Sheet. This chart takes into account the fact that investment is strongly influenced by two extremes of human emotion—fear and greed. Related: China Is Taking Data-Mining To The Next Level
At the top of the Wall Street Cheat Sheet is euphoria. This is the time when investors think that nothing can go wrong and throw all caution to the wind. This becomes a self-feeding cycle with more investors flocking in in droves, leading to an even bigger rise in price and valuations getting out of whack.
Eventually, reality hits back with a vengeance.
The crypto market was euphoric during the final quarter of 2017 and bitcoin prices climbed from $6,000 to $20,000 in seven weeks flat. At one time, you could hear several pundits spouting out $50,000 and even $100,000 as bitcoin’s next stop. Regulatory crackdowns in China and South Korea, however, finally burst that bubble. Back then, the two countries were some of the biggest sources for bitcoin demand.
The bitcoin market has since then gone through three stages—complacency, anxiety and denial before settling at the panic stage. The denial stage was prolonged and was marked by bitcoin’s valiant defense of $6,000 for several months. But eventually, the currency dropped like a rock with volumes spiking more than 30 percent in November compared to the previous month.
A break below $3,000 is likely to usher in the capitulation phase--then all bets are off as to how low it will sink before staging a relief rally.
By Alex Kimani for Safehaven.com
More Top Reads From Safehaven.com


