


Warren Buffett’s favorite indicator is telling us that stocks are more overvalued right now than they have ever been before in American history.
That doesn’t mean that a stock market crash is imminent. In fact, this indicator has been in the “danger zone” for quite some time. But what it does tell us is that stock valuations are more bloated than we have ever seen and that a stock market crash would make perfect sense.
So precisely what is the “Buffett Indicator”? Well, it is actually very simple to calculate. You just take the total market value of all stocks and divide it by the gross domestic product. When that ratio is more than 100 percent, stocks are generally considered to be overvalued, and when that ratio is under 100 percent stocks are generally considered to be undervalued. The following comes from MSN…
That being said, the Buffett Indicator, while it’s not a flawless indicator, does tend to peak during hot stock markets and bottom during weak markets. And as a general rule, if the indicator falls below 80 percent-90 percent or so, it has historically signaled that stocks are cheap. On the other hand, levels significantly higher than 100 percent can indicate stocks are expensive.
For context, the Buffett indicator peaked at about 145 percent right before the dot-com bubble burst and reached nearly 110 percent before the financial crisis.
Related: Homeland Security Takes Clear Stance On Russian Hacking
So where are we today?

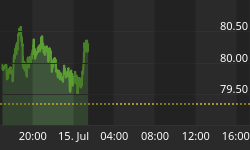
(Click to enlarge)
Right now we are at almost 149 percent, which is the highest level ever recorded…
Where does the Buffett Indicator stand now? It may surprise you to learn that, at nearly 149 percent, the total market cap to GDP ratio has never been higher. It’s even higher than the 145 percent peak we saw during the dot-com bubble.
In recent days we have seen a “tech bloodbath”, but that was nothing compared to what is eventually coming. Ultimately, the stock market would need to fall by at least one-third in order for prices to be properly balanced again.
And it appears that Warren Buffett is taking his own advice. His company is currently sitting on more than 100 billion dollars in cash…
Having said that, it does seem like Buffett himself is paying attention and agrees that the market is generally expensive. After all, the lack of attractive investment opportunities has resulted in Berkshire Hathaway accumulating nearly $110 billion of cash and equivalents on its balance sheet. Plus, Buffett has specifically cited valuation when discussing the absence of major acquisitions lately.
Warren Buffett didn’t become one of the wealthiest men in America by being stupid. He knows that valuations are absurd right now, and he is waiting to strike until valuations are not so absurd.
And he knows that another recession is inevitably coming. I wrote about some of the trouble signs yesterday, and more trouble signs seem to pop up on a daily basis now.
Earlier today, CNN published an article entitled “Two recession warning signs are here”…
Home sales have declined in four of the past five months as housing prices have grown — but paychecks have remained stagnant. Many people can’t afford to buy homes, and those who can are taking on a lot of debt to get into them.
I feel really bad for those that purchased a home in recent months, because those poor people are getting in right at the top of the bubble. The housing bubble is about to burst in a major way, and there will be a tremendous amount of pain afterwards.
And we received more bad news about the housing market on Wednesday. According to Redfin, housing demand plunged 9.6 percent in June…
Related: Trump Administration Offers Alternative To ‘One Belt, One Road’
The long list of housing headwinds is finally taking its toll on potential buyers. Housing demand fell 9.6 percent in June, compared with June 2017, according to a monthly index from Redfin. That is the largest decline since April 2016.
CNN’s second “warning sign” is the fact that the yield curve is about to invert…
The Federal Reserve, which is finishing up its two-day meeting Wednesday, is expected to raise its target rate two more times this year. Higher rates have boosted short-term US Treasury bond rates. But the longer-term bond rates haven’t risen along with the shorter-term rates, because investors are growing wary about the economy over the long haul.
With two more interest rate hikes planned, the Fed could boost short-term rates higher than long-term ones, inverting the so-called yield curve. An inverted yield curve has preceded every recession in modern history.

(Click to enlarge)
In recent weeks, there has been renewed interest in my economics website as people begin to wake up and understand that a major economic crisis is looming. Of course the truth is that we are way, way overdue for a stock market crash and another recession. The only thing that is surprising is that it took us so long to get here.
Sadly, most people are still very much asleep. Average Americans spend most of their waking hours staring at either a television or a computer screen, and the big media companies control almost all of the media that we are so voraciously consuming. Instead of thinking for themselves, most people simply regurgitate what they have been fed by the media giants, and we are never going to turn things around if we continue to allow “the matrix” to tell us what to think.
The Buffett Indicator is very simple, but it is also very accurate. If you want to do well in the stock market, you want to buy low and sell high, and right now we are in absurdly high territory. Stock valuations always return to their long-term averages eventually, and many believe that the coming stock market crash is going to arrive sooner rather than later.
By Zerohedge
More Top Reads From Safehaven.com


