"No warning can save people determined to grow suddenly rich" - Lord Overstone
 |
Gold •716 days | 2,368.70 | +35.30 | +1.51% |
 |
Platinum •10 mins | 1,668.20 | -39.10 | -2.29% |
|
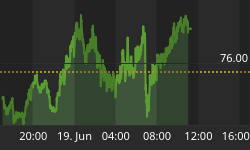
WTI Crude •5 hours | 76.54 | +0.69 | +0.91% |
|
Gasoline •5 hours | 3.004 | +0.009 | +0.31% |
|
Ethanol •716 days | 2.161 | +0.000 | +0.00% |
|
Silver •716 days | 30.82 | +1.16 | +3.92% |
 |
Silver • 716 days | 30.82 | +1.16 | +3.92% | |
|
Copper • 716 days | 4.530 | +0.111 | +2.51% | |
|
Brent Crude • 5 hours | 80.57 | +0.72 | +0.90% | |
|
Natural Gas • 5 hours | 3.198 | -0.035 | -1.08% | |
|
Heating Oil • 5 hours | 3.195 | +0.067 | +2.15% |
Markets / Other

Elliott Wave Analysis On GBPJPY And EURJPY
Pound keeps moving lower across the board, so we think that GBJPY will also stay under pressure for a few more sessions if we consider falling USDJPY. On the 4h…
USD/JPY - Trading In Range
USD/JPY's short-term buying pressures have faded around hourly resistance given at 102.83 (02/08/2016 high). A failure to go above 102.83 indicates a continued medium-term bearish momentum. Hourly support ...
Stock Market: Likely Pullback into Friday
We have Venus trine Pluto tonight, which could also mean exhaustion of upside pressure on the open Thursday. GDX looks like it could fall below $30 by Friday (Monday latest),…
The Colombian Peso Going Higher
The Colombian peso has increased value against the US dollar as laid out in previous analysis, The Colombian Peso!, produced on 21st February 2016 when the USDCOP was trading at…
Why the U.S. Benefits from Global Financial Crisis
Let's turn our attention to the global economy. Last week the Bank of England said it would buy 60 billion pounds of government debt in order to cushion the economy…
Elliott Wave Analysis On GBPUSD And USDCAD
On the 1h chart of GBPUSD we are observing a nice little rally from red wave C) that can be bottoming. Reason for a potential bullish view is a five…
This Suggests That Silver Will Soon Spike Significantly Higher
The silver price and the US Dollar/South African Rand exchange rate (USD/ZAR) have a very interesting relationship that goes back a long way.
Wake Up and Smell the Bull Trap!
We are currently experiencing a "Kondratiev Winter" stage in this stock market which is at its' "tipping" point. This is where nominal to incremental highs on the SPX can be…
Negative Interest Rates: Can They Ever Occur Naturally? What is the 'Natural Rate'?
The Bank of Japan and the ECB illogically set the rate negative, with detrimental consequences. The Fed sponsored asset bubbles in 2000, 2007, and again now in search of the…
VIX Update
If you look at the chart, the VIX has a long term support line that it is finally testing. Remember ... that a higher VIX equals a lower market since…


