As the world continues to grapple with an unprecedented health crisis caused by the COVID-19 pandemic, many economists are drawing parallels between the current situation and the 2008 financial crisis. The consensus appears to be that if the last economic crisis was a bad seizure, the current one is going to be a full-blown heart attack. During the second quarter, the U.S. economy is expected to go into the worst recession in modern history, with growth projections ranging from -9% at the low end by Bloomberg Economics to an incomprehensible -40% by Capital Economics, thanks to a global shutdown.
Whereas many economic indicators are lagging indicators and are, therefore, of little help in predicting the future, reports such as the latest one by the Federal Reserve Bank of Dallas that shows the Texas Manufacturing Outlook Survey plunged from +16.4 in January to -35.3 in February make for a tragic, if sobering, reality.
Here are four key reasons why the coronavirus pandemic is set to cause the biggest economic disruption in modern history.
- Jobless claims reach record highs
One of the most closely-watched data points by investors tracking the health of the economy is known as jobless claims. Jobless claims are a statistic provided by the U.S. Department of Labor which shows the number of unemployed people filing to receive unemployment benefits. Unlike many economic indicators, jobless claims are considered a leading indicator because they provide a pretty accurate picture of the state of the job market and the overall health of the economy.
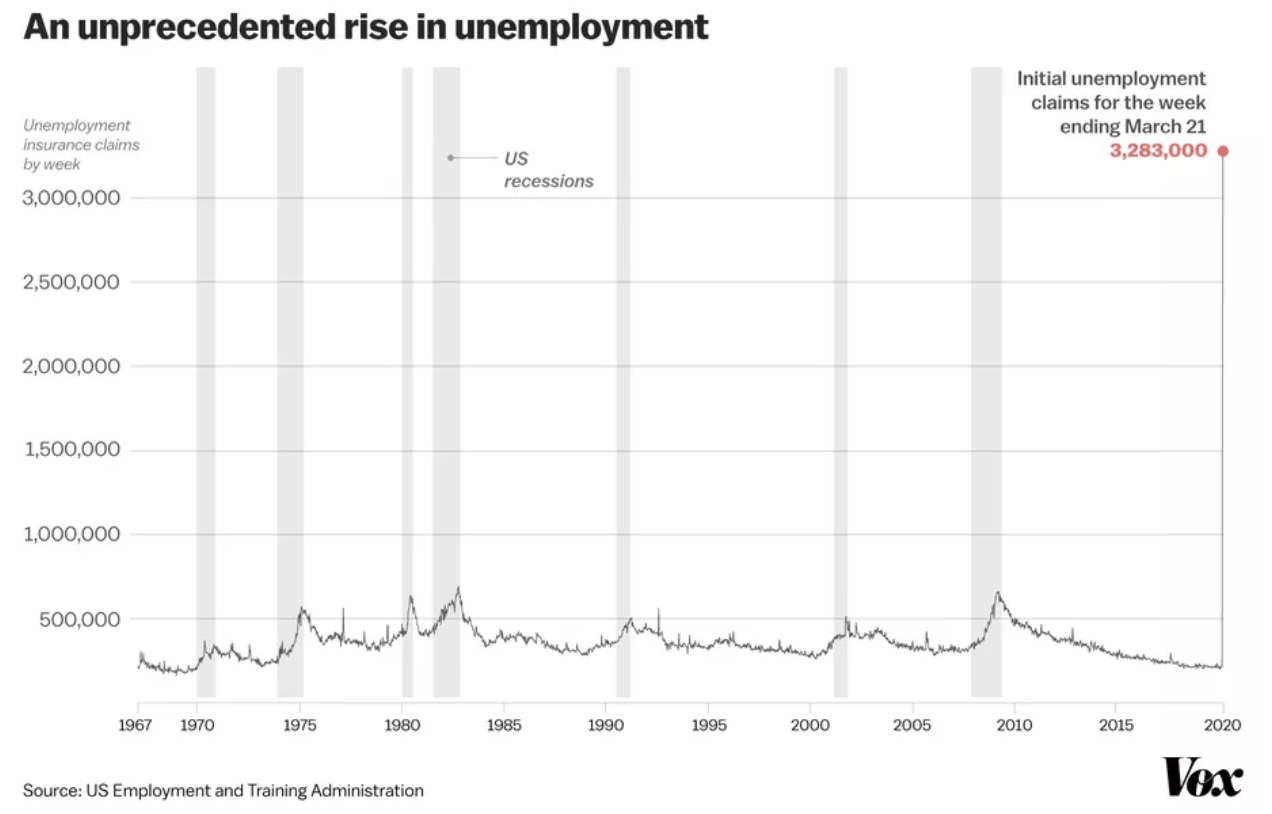
The U.S. Department of Labor has collected this data since 1967, with the week ending September 18, 1982, previously going down as the worst in history ater 680,000 people claimed unemployment.
That’s the reason why the latest jobless claim figure of 3,283,000 new claims, or 5x higher than any in history, shocked economists everywhere. Everybody knew the coronavirus situation was worse than anticipated; still, the consensus was for 1.5 million new claims. Even the most pessimistic analyst, Goldman Sachs, was only expecting 2.25 million new claims.
With people being encouraged to stay at home, trade, manufacturing and consumption are bound to take a big hit. That’s really bad news because 60% of the global economy revolves around trade.

Source: Vox
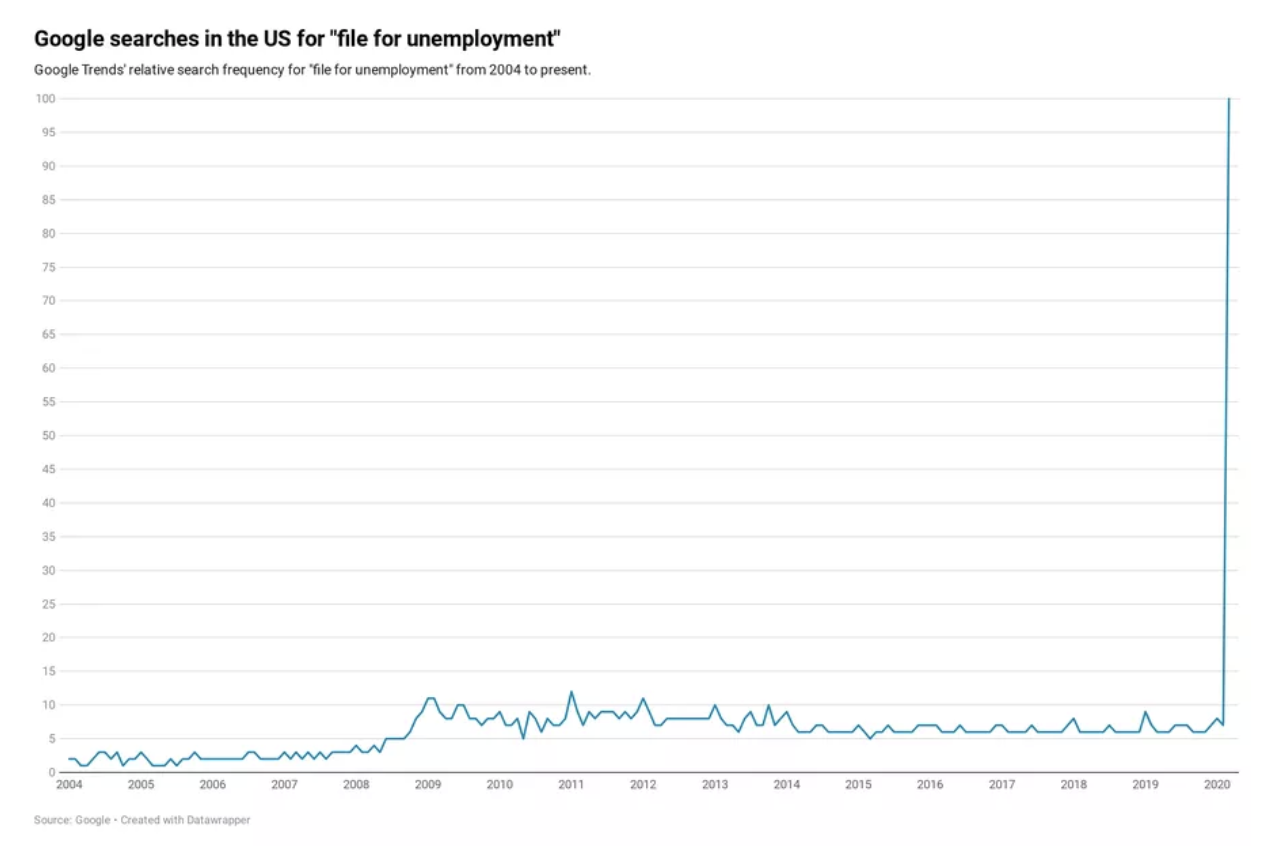
The spooky thing is that another leading indicator has also emerged in the quagmire: Google Trends. According to Yale’s Paul Goldsmith-Pinkham and the University of Minnesota’s Aaron Sojourner, Google searches for “file for unemployment” are showing an ‘‘absurdly high’’ correlation with actual jobless claim filings.

Source: Vox
Another shocking statistic: fully third of Americans have at least one person in their household who has either suffered a pay cut or been laid off. This suggests that a much wider cross-section of demographics has been affected by the coronavirus pandemic than plain jobless data reveals.
- ‘Everything has to go’ sale
There’s a phenomenon in financial circles commonly known as ‘flight to safety’ trade where investors tend to take money from riskier instruments like stocks and put it into instruments deemed more secure such as gold and bonds during times of widespread fear and panic.
But what we are currently witnessing is an “everything has to go” sale that’s sweeping through equities, commodities and corporate debt.
The popular bond benchmark, the iShares Core U.S. Aggregate Bond ETF, is up a mere 3.5% in the year-to-date.
Meanwhile, U.S. Treasuries have not been spared the malaise either.
Money managers tend to rely heavily on long-dated bonds as downside protection for the broader portfolio. Yet 10-year U.S. Treasuries have only traded up a couple of percentage points at a time when the S&P 500 has plunged more than 20% over the past 30 days. Economists now fear that the day of reckoning is fast approaching for the U.S. government’s massive fiscal deficits with the investors’ appetite for U.S. bonds waning.
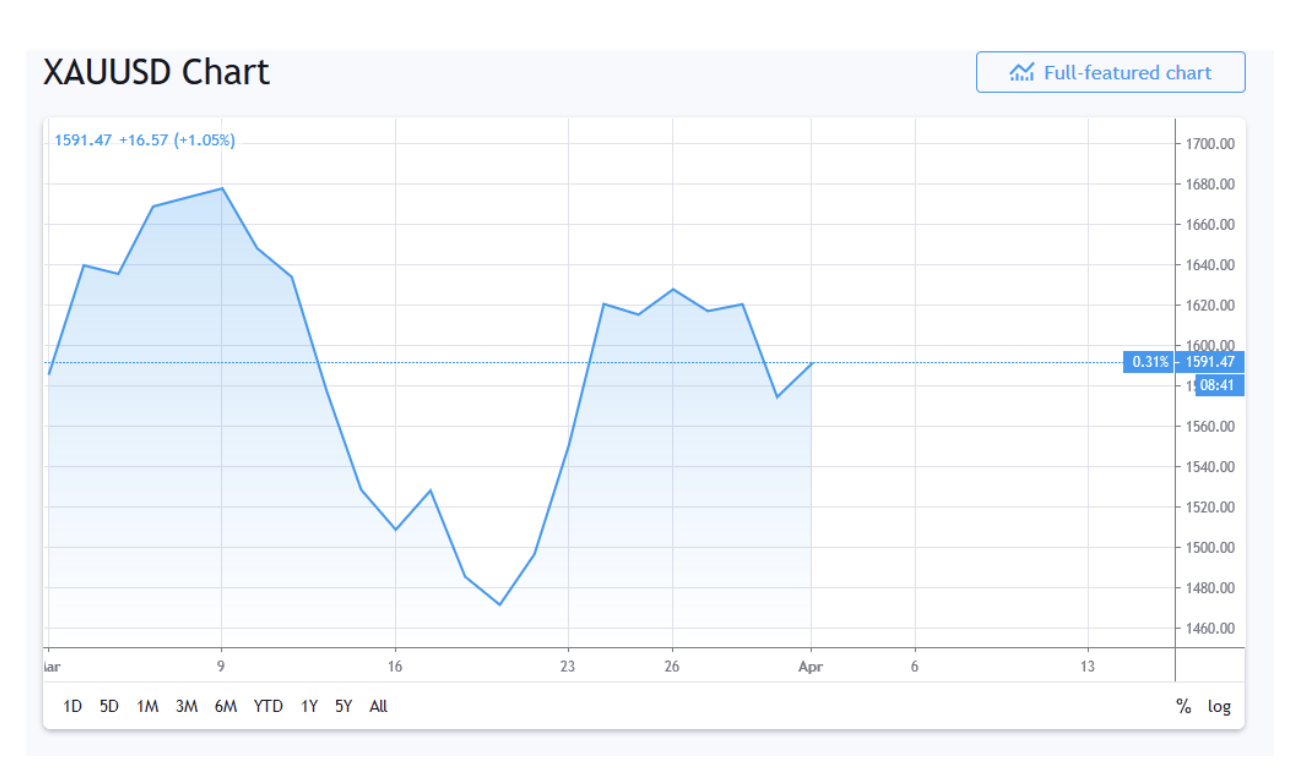
Even gold prices have been treading water lately, up a mere 0.31% over the past 30 days even as the coronavirus pandemic puts a large section of the world on lockdown. As Chintan Karnani, chief market analyst at Insignia Consultants, has observed, no investment is safe anymore.
This gold phenomenon though could be due to the yellow metal consolidating its gains after a torrid run that pushed prices 24% higher over the past 12 months.

Source: TradingView
- Shocking capital flight in emerging markets
Emerging markets tend to be more volatile than developed ones even in good times. Consequently, investors tend to liquidate their emerging market assets during times of market stress.
Related: Trump Wants Another $2 Trillion Economic Intervention
Yet, the outflows from emerging markets are much more severe and much more rapid this time around compared to the 2008 global financial crisis. China, India and many other emerging market countries were able to survive the worst vagaries of the last housing bubble burst. This time everybody is likely to end up being badly hurt, not least because the pandemic has struck most parts of the world with shocking savagery.
- A better indicator than the Dow Jones
The Dow Jones Industrial Average has for long been regarded as a useful indicator of the state of the U.S. economy simply because it’s representative of 30 diverse sector bellwethers. The Dow Jones can, however, give a false sense of security, such as when it rallied 6.4% on the day when the record jobless claims were unraveled simply on technical grounds. Stocks, in general, might not be a good indicator of the health of the economy due to the pervasiveness of algorithmic trading which runs on programs based on pricing and liquidity patterns.
The Federal Reserve’s Weekly Economic Index (WEI) is a much more comprehensive index designed to look at the broader picture of what is happening in the real world economy. The WEI is comprised of same-store retail sales; initial unemployment insurance (UI), a measure of steel production, a measure of electricity consumption and a measure of fuel sales.
Unfortunately, the WEI is telling a chilling story, with the current reading even worse than it was back in 2008.

Source: Forbes
By Alex Kimani for SafeHaven.com
More Top Reads From Safehaven.com:


https://dumbwealth.com/coronacrisis/