 |
Gold •583 days | 2,368.70 | +35.30 | +1.51% |
 |
Platinum •10 mins | 2,099.40 | +28.80 | +1.39% |
 |
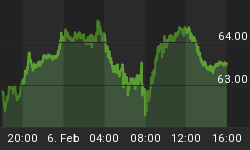
WTI Crude •19 hours | 63.55 | +0.26 | +0.41% |
 |
Gasoline •19 hours | 1.953 | +0.027 | +1.38% |
 |
Ethanol •583 days | 2.161 | +0.000 | +0.00% |
 |
Silver •583 days | 30.82 | +1.16 | +3.92% |
 |
Silver • 583 days | 30.82 | +1.16 | +3.92% | |
 |
Copper • 583 days | 4.530 | +0.111 | +2.51% | |
 |
Brent Crude • 18 hours | 68.05 | +0.50 | +0.74% | |
 |
Natural Gas • 19 hours | 3.422 | -0.087 | -2.48% | |
 |
Heating Oil • 19 hours | 2.413 | +0.020 | +0.84% |

Brad Gudgeon
Contributor since: 01 Jun 2014
Biography
BluStar Market Timer Investment Philosophy: The stock market is currently in a technical Elliott Wave Bear Market Rally. It has been exhibiting A-B-C type waves instead of the normal 5 Waves since the market topped in 2000. According to "The Original Works of R.N. Elliott", we are due for a move down to about the S&P 500 442/443 area in the next few years. In my opinion, this is no longer a buy and hold market, but a traders' market. We mainly swing trade the market with funds and ETF's, but otherwise trade according to the market's disposition and to the traders' discretion. For the year 2014, BluStar Market Timer is rated #1 according to Timer Trac.
-
Why the Stock Market Must Fall Hard Monday
I have been warning for over a week now about a coming waterfall decline. The wave counts and cycles are at the point where I…
-
Market Forecast: OPEX Week July 2017
I have SPX falling to 2444/45 Wednesday and GDX down to near 21.90/.93. By Friday SPX should be tagging 2479 +/- and GDX to near…
-
Market Forecast: OPEX Week July 2017
I have SPX falling to 2444/45 Wednesday and GDX down to near 21.90/.93. By Friday SPX should be tagging 2479 +/- and GDX to near…
-
Quick Airpocket Ahead, Miners Look Good
The stock market is due for a sudden air pocket, likely from Tuesday to Thursday this week. My downside target is 2398 +/-. We are…
-
Good Sized Drop in Equities, Rally in Gold Near
Today (June 8) is the 4/16 TD top. The next low is due on June 12. A sudden sharp sell-off in equities (likely June 9)…
-
Last Week's Shallow Drop Portends Bigger Drop Ahead
Last week, I was looking for a pull back into May 31's 8 TD low. The move down, however, was extremely shallow (wave 'b' 2418…
-
Stock Market Pull Back Shallow, More to Go
The market is gradually becoming oversold with much resistance. The cycles suggest a low no later than around Friday this week. May 17th is the…
-
Stock Market: Alternate Projection
The chart below shows the alternate projection going forward for the S&P 500. This projection shows an extended 4 trading days to the normal 16…
-
Stock Market Due for Minor Pull Back
Over 2 weeks ago, I was looking for a top on April 26th and another on May 1. Today's top appears to be a secondary…
-
Stock Market, Gold Miner Update
We entered into a Mercury Retrograde period on April 9, which I have said before is like trading in the Bermuda Triangle, difficult at best!…
-
SPX and GDX in Perspective
Below are daily charts of the S&P 500 and the gold miners index ETF, GDX. Right now, it seems as though these two are trading…
-
Short Term Stock Market Bottom Close
Last week, I was looking for weakness not to exceed 4%. The drop was closer to 1.7%. A positive divergence is occurring on the 1…
-
A Stock Market Dip in the Offing?
Right now, the coming dip could be a little scary, but shouldn’t amount to much, maybe around 4%. My guess is the first couple of…
-
Important Stock Market Top?
Cycle-wise, we are at a crest of the 18 month cycle, which is due to bottom in early August 2017. Astro-wise we have a myriad…
-
Minor Stock Market Pull Back Due
The week before last, I had alerted my subs that it didn't look like the 24 TD balance low would work (but that the 11…
-
The 4% Drop Ahead: Down into February 6?
The chart below explains why I now believe we drop down into February 6th to the 2202 SPX level. The next few days may be…
-
The Long Awaited 4% Pullback May Be Close
Last time I wrote, I said that a 10-week bottom was close and could come as late January 31. Venus square Saturn (today) has a…
-
Stock Market Still Vulnerable for 3% Pull Back
We are in TD 52 of the ten week cycle low due 50 TD's +/- 7.5 TD's. The smaller 8/16 TD low is due ideally…
-
Inauguration Day Selling in Stock Market?
Last time I wrote, I discussed the possibility of a Friday the 13th sell-off. Did I really believe it would happen? Actually, the odds were…
-
Unlucky Friday the 13th?
The stock market is nearing the ten week cycle low from November 4th, 2016. The daily Bollinger bands are tightly squeezed together suggesting a break-out…


