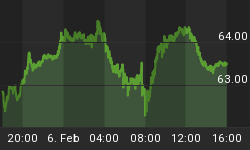
Gold has provided two excellent trades for us this year; both had less than 3% downside risk. With any luck we will have another trade soon. Gold has been forming a large reverse head and shoulder pattern since early March and currently trying to form the right shoulder. If this pattern completes and the price breaks the neck line at the $99 level we should see a nice rally towards the $120 - $130 level.
The sochastic indicator turned up in the lower reversal zone this week providing more power to Wednesday's reversal candle. We could see the price bounce here, but until momentum turns back up I will be watching and waiting for a proper low risk setup.

Silver Trading Chart
Silver pulled back just as we expected it would. The stochastic indicator is starting to turn up and the price of silver is near support. I think we will see some sideways/bounce at this level. Again I am not jumping on the train yet. I prefer to wait for the downward momentum to shift to the upside before putting my hard earned money to work.

USO Oil Trading Chart
Oil has been on a crazy run since the breakout back in May. The oil price is currently at a pivot point and could go either way quickly. A break of this support trend line will trigger speculate traders to sell and that will sent oil tumbling quickly. Those of you long oil should be ready to jump if we see continued weakness. If you are a long term oil bull, then taking some profit at this level and still holding a core position could be a good idea. You can always buy back the shares you sell and if we see lower prices you will benefit even more.

UNG Natural Gas Trading Chart
UNG made a breakout this week from its pennant formation. Volume is telling us that this could very well be the start of a trend reversal (higher prices). This trade setup carried a high risk level which was 12% on Monday. I focus on trades with 3% or less so I was not buying on this breakout. Instead I am waiting for a consolidation which should provide us with a low risk setup in the near future.

Trading Conclusion:
This month commodities are under selling pressure along with most stocks. I continue to wait for the charts to generate low risk buy signals for these funds. On a side note we may get some trading signals for some other sectors which are becoming hot like the biotech and health care funds. I will keep you posted.
If you would like to receive my Free Weekly Trading Reports or my Trading Signals please visit my website at: www.GoldAndOilGuy.com


