


I last mentioned Treasury Inflation Protected Securities or TIPs in an article written on September 10 entitled, "If You Don't Like 'em, Then Don't Trade 'em". In that article, I discussed the fact that there were other places to look for that "fat pitch" besides U.S. equities. If you didn't like the risk in equities, then play in another sandbox.
"So where is that "fat pitch"? The Dollar Index remains in a down trend, and those assets denominated in the currency have been and should continue to move higher. Precious metals, commodities, and foreign developed and foreign emerging markets should be relative out performers. I have been on this theme for 3 months now. This is old news in my book.
Another place to consider are TIPs or Treasury Inflation Protected Securities. Yes, a lower Dollar and higher commodity prices will flame the inflation debate, but I don't think TIPs are an inflation play but rather a safe haven play."
Since September 10, the S&P500 is up 4.78%, and the i-Shares Lehman TIPS Bond Fund (symbol: TIP) is up 2%. But on a risk adjusted basis, TIP is about one half as volatile as the S&P500. So this 2% move in TIP is more like 4%. So on a risk adjusted basis, the percentage moves in these assets are almost identical. If I were allocating capital between these two assets (which I am), it is likely that I would allocate twice as much capital to TIP as to the S&P500 thus equalizing my risk across assets.
This analysis has nothing to do with the tactical part of the equation either. By this I mean, that equities appear more risky to me at this juncture then TIP's. I am still not clear why TIP's are headed higher. It could be inflation or as a safe haven play. (I have tended to think it is the latter and discussed this in the article from August 28 "TIP vs. SPY). But, it really doesn't matter what I think. TIP has the technical qualities of an asset headed higher.
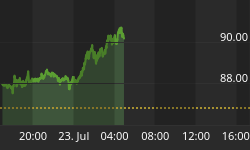
Figure 1 is a monthly chart of the i-Share Lehman TIPS Bond Fund (symbol: TIP), which I showed in the previous article. Technically, a break out over a trend line formed by two prior pivot high points (red dots) is bullish, and this occurred back in July. This is noted by the up blue arrows in the figure. Last month in another sign of bullish strength, TIP closed above the immediate pivot high point at 102.75. This is now support and a monthly close below this level is reason enough to liquidate this trade.
Figure 1. TIP/ monthly
Figure 2 is a daily chart of the TIP with volume in the middle graph and the on balance volume indicator (with 40 day moving average) in the lower panel. This is accumulation. There is increasing and above average volume (green volume bars) on up days, and for the most part, these days out dwarf the big volume (red bars) down days. Furthermore, the on balance volume indicator is making new highs along with price.
Figure 2. TIP/ daily
As a reminder, let's contrast this with figure 3, a daily chart of the S&P Depository Receipts (symbol: SPY). I believe this represents distribution. Very few up days (green volume bars) are met with above average volume, and the majority of down days (red bars) over the past month have been on above average volume. Furthermore, the on balance volume indicator is diverging from price.
Figure 3. SPY/ daily
Two final points.
One, I want to mention that I didn't come to TIP because I am on some volume or on balance volume kick of late. I came to this asset because of looking for the next "fat pitch" - those assets that have the technical characteristics of showing a major change in trend. The fact that TIP is breaking out and under accumulation is just a by-product of the fact that it has those secular tailwinds.
Two, if I was an all equity all the time kind of person, I would be wondering about the significance of this breakout in TIP. I don't think it should be viewed as a positive sign for equities.


