


The CBOE 10-Year Treasury Yield Index (TNX) closed Wednesday at 39.77, a low for the year as well as a 3 1/2-month low. TNX is completing an exhaustion downside move that should shortly reverse and gave a preliminary indication of this on Thursday by closing above its 5-day moving average.
Wednesday's 1.49% decline broke TNX below an immediate-term downtrend channel, thus sending a "channel buster" exhaustion signal (i.e., indicating an oversold rally is near). TNX has been pushed lower in recent weeks by its 5/10/15-day moving averages but the expected technical rally could retrace a good part of this decline.

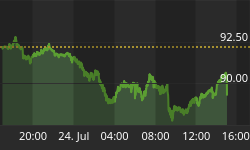
The above daily chart of the 10-year Treasury Yield Index shows that TNX is now testing the outer rim of a 4-month parabolic dome but this dome should be broken soon. A nascent parabolic bowl (see above) is also forming, which should act as a support for TNX as well as shepherd the yield to higher levels.
Speaking of interest rates, I ran across an insightful mini-editorial on this subject recently while perusing the London Financial Times. Michael Mimicopoulos was rebutting the argument that falling real interest rates reflect a growing shortage of attractive investment projects to absorb savings. He writes, "By looking at only the supply side, [this] is ignoring the other side of the equation, namely the demand side. Long-term bond yields are lower in the world's biggest economies compared to five or six years ago because, following the excesses of the 1990s, companies have found it prudent to repair their balance sheets, in the process financing expansion plans from corporate cash flows rather than external sources of finance."
This is a good point and one that leads to another observation I've often made, namely that analysts quite often ignore the demand side of the equation in reviewing a number of monetary and economic issues. For instance, money supply. How often do we hear financial commentators bemoan either a rise or a fall in the money supply, yet they fail to compare this to the underlying demand for money.
Probably the best way of measuring both the supply and demand side for monetary liquidity is the yield curve consisting of the 10-year T-Note yield divided by the short-term T-bill yield. Currently the yield curve is in a good position to support at least one more leg of the bull market rally that we expect to commence later this month and carry us into early spring. More on this later...


