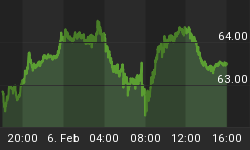
This week-end, we did a small exercise; we counted the number of sessions (in recent short cycles) from bottom to top and from top to bottom.
- The first surprise is that recent cycles were symmetric: the number of sessions from the bottom to the top is roughly the same than the number of sessions for the following correction.
- The second interesting point is that the length of (recent) up cycles is between 13 and 27 sessions.
For the time being there is two possibilities: either we recently printed a ST top and the up cycle's length was 14 sessions or the ST top should occur in coming sessions but in this case the up cycle's length would already be 22 sessions. As the longest up cycle was 27 sessions (in the last 6 months), we can reasonably consider that either the top has already been printed or it should be printed next week.
We can notice on the chart that Friday's session was an inside day (higher low and lower high relative to Thursday). So, this candle isn't as strong as it seems.

Looking at our indicators, we can notice that up and down mini-cycles are shorter and shorter. We can also notice that impulse moves in opposite direction occur in a very short time (negative impulse on Thursday vs positive impulse on Friday). This kind of situation underlines that the market is very nervous and much more nervous than it seems at first glance.

Following recent volatility in the market, our ST model updated its stop levels on both the CAC and the EuroStoxx50:


Short Term Trading Book:
- SPX: 1 short at 1742.85 (stop @ 1783, 3pts above the ST model to take into account bid/ask spread)
- NDX: 1 short at 3361.01 (stop @ 3441, 5pts above the ST model to take into account bid/ask spread)
- CAC: 1 short at 4272.14 (stop @ 4372, 5pts above the ST model to take into account bid/ask spread)
- DAX: no more position
- EStoxx: 1 short at 3027.17 (stop @ 3108, 5pts above the ST model to take into account bid/ask spread)
Medium Term Trading Book:
- No more medium term position at this stage.
For those of you interested in our trades or in our methodology, you can visit our site. A full description of our ST model and MT model is available on our site. You can also subscribe to our twitter account (@SigmaTradingOsc), it is free and you are updated on our latest view/trades.


